A good network diagram can be the key to IT team alignment and fast, consistent service.
But how do you build a diagram your team will actually want to use?
Keep reading to learn more about what network diagrams do, how they work, and how to create your own using Gliffy, a network diagram tool for Confluence.
Back to topWhat is a Network Diagram?
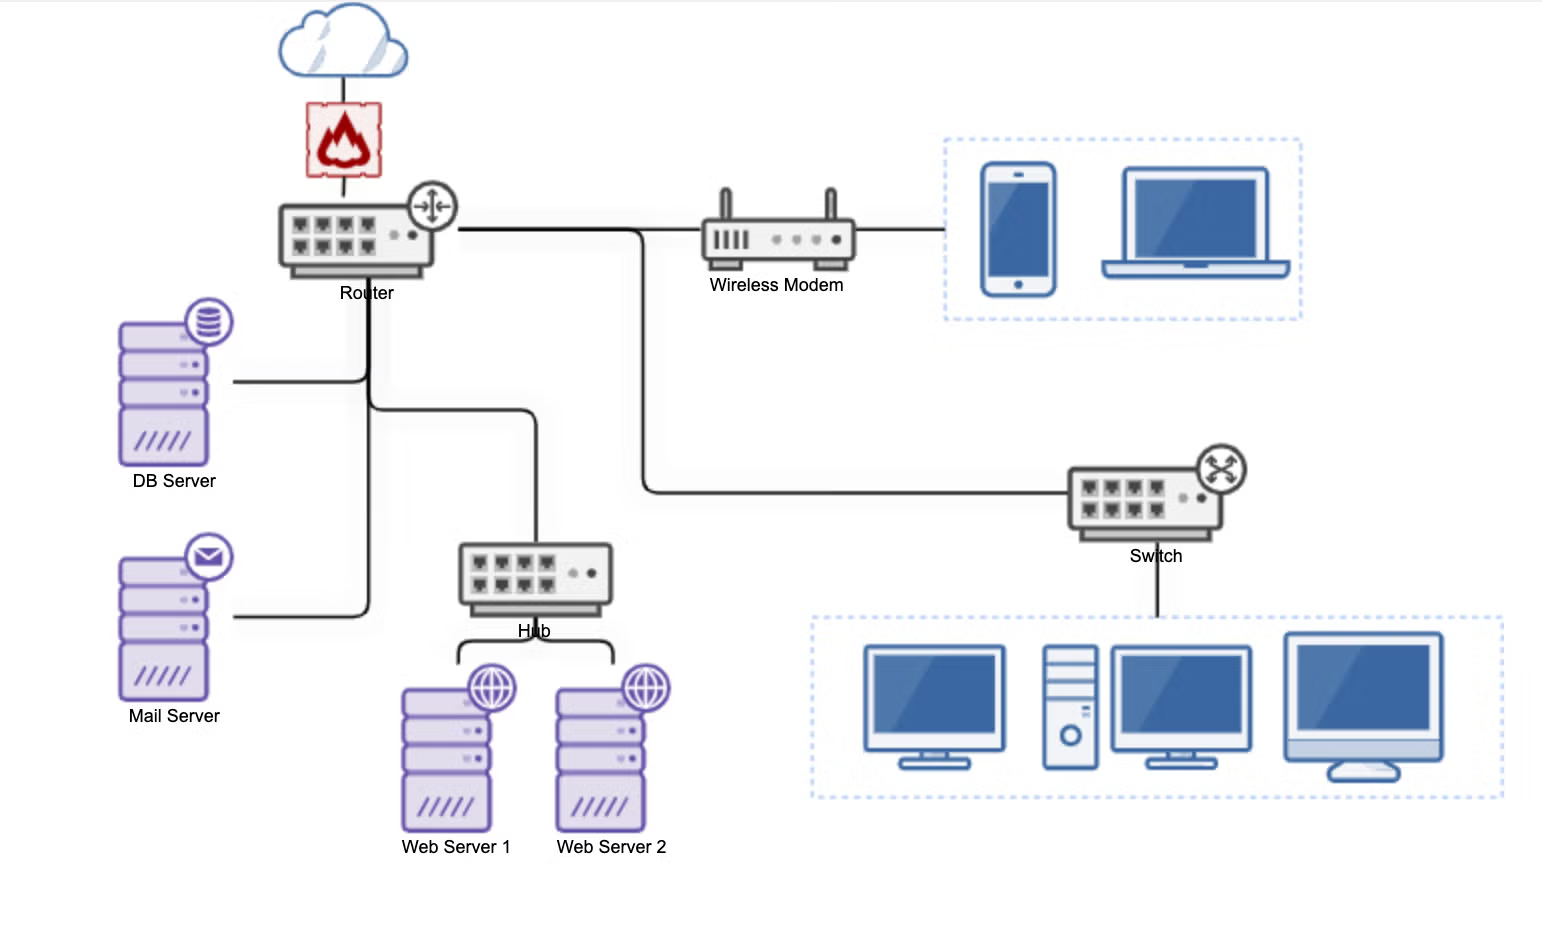
A network diagram is a visual representation of a network’s structure, which can include both physical and logical arrangements of nodes and connections.
A network diagram typically shows routers, firewalls, and devices such as desktop computers, laptops, or printers. More importantly, however, it shows how all these components interact with one another.
Most network diagrams fall into one of two categories: physical or logical. Both logical and physical network diagram types help you onboard new team members, work on cross-functional teams where not everyone has the same level of technical expertise, and explain decisions or requests to leadership and executive teams.
What is a Physical Network Diagram?
A physical network diagram shows how hardware is arranged – think of it as a floor plan for your network.
It’s common to create a physical network diagram for an office, because it can help you keep track of which devices are located where and how they are physically connected to one another.
What is a Logical Network Diagram?
A logical network diagram is focused not on which devices make up a network, but rather on how data flows through the network and how components of the network communicate with one another.
Logical network diagrams often describe details of LAN (local area) and WAN (wide area) networks or explain the security in place to protect your network.
Logical diagrams include the same types of components as physical diagrams but may generalize about the number or location of certain devices within the network. For example, a physical network diagram may include the hardware at each desk space in an office, while a logical network diagram may use one standard desk space setup to represent all the desks in the office.
You can make a logical network diagram to:
- Show how your network complies with security requirements
- Plan and manage updates to your network
- Describe or pitch a new network or update to non-technical stakeholders
- Troubleshoot issues
Network Diagram Layouts
The layout of your network diagram will depend on how your network is built, but there are a few common structures that form the baseline of many networks. These structures are called network topologies.
Some common examples of network topology include star, ring, bus, and mesh topology. To learn more about these types of network topologies and how they should be visualized, visit our blog on network topology diagrams.
Back to topNetwork Diagrams in Project Management
Sometimes, you might run into the term “network diagram” in project management. This is a different type of diagram than the network diagram used in IT management.
In project management, a network diagram’s purpose is to help the project manager and their teammates visualize the tasks that need to be completed during a project.
Not only does it list the tasks themselves, but it also provides information about how long each task might take and in which order they need to be completed. Having a visual representation of this information makes it easier to plan the project, assign tasks as needed, and communicate project updates and requirements to stakeholders.
Other types of project management diagrams include PERT charts, RACI charts, and Kanban boards.
For this guide, however, we’re going to focus on the type of network diagram that describes the components and relationships of a technical network – the type that IT professionals would create rather than project managers.
See examples of network diagrams >>
Back to topWhy Create a Network Diagram?
Network diagrams are a helpful resource for IT teams as they serve their customers and work on their own projects to improve systems.
With a good, up-to-date network diagram, you can:
- Know where devices are physically located.
- Understand the dependencies that affect different areas of the network.
- Identify areas with inefficiencies or bottlenecks that can be improved.
- Keep your team on the same page about network status and updates.
Video Tutorial: Create a Network Diagram in Gliffy
Start your free evaluation of Gliffy to follow along with these steps.
Back to top
How to Draw a Network Diagram: 6 Easy Steps
In this example, we’ll plot out a basic network diagram, but these techniques will apply to all network diagram types regardless of complexity.
Follow along with these steps to learn how to create a network diagram in Gliffy for Confluence.
Open Network Diagram Symbols
When you open a new Gliffy diagram by typing /gliffy on any Confluence page, you might not see the network diagram symbols in the shapes panel right away. If not, it’s easy to add them.
Just click More Shapes at the bottom left of your screen and select the Network shape library. This will add a wide variety of network diagram shapes for you to quickly drag and drop onto the canvas.
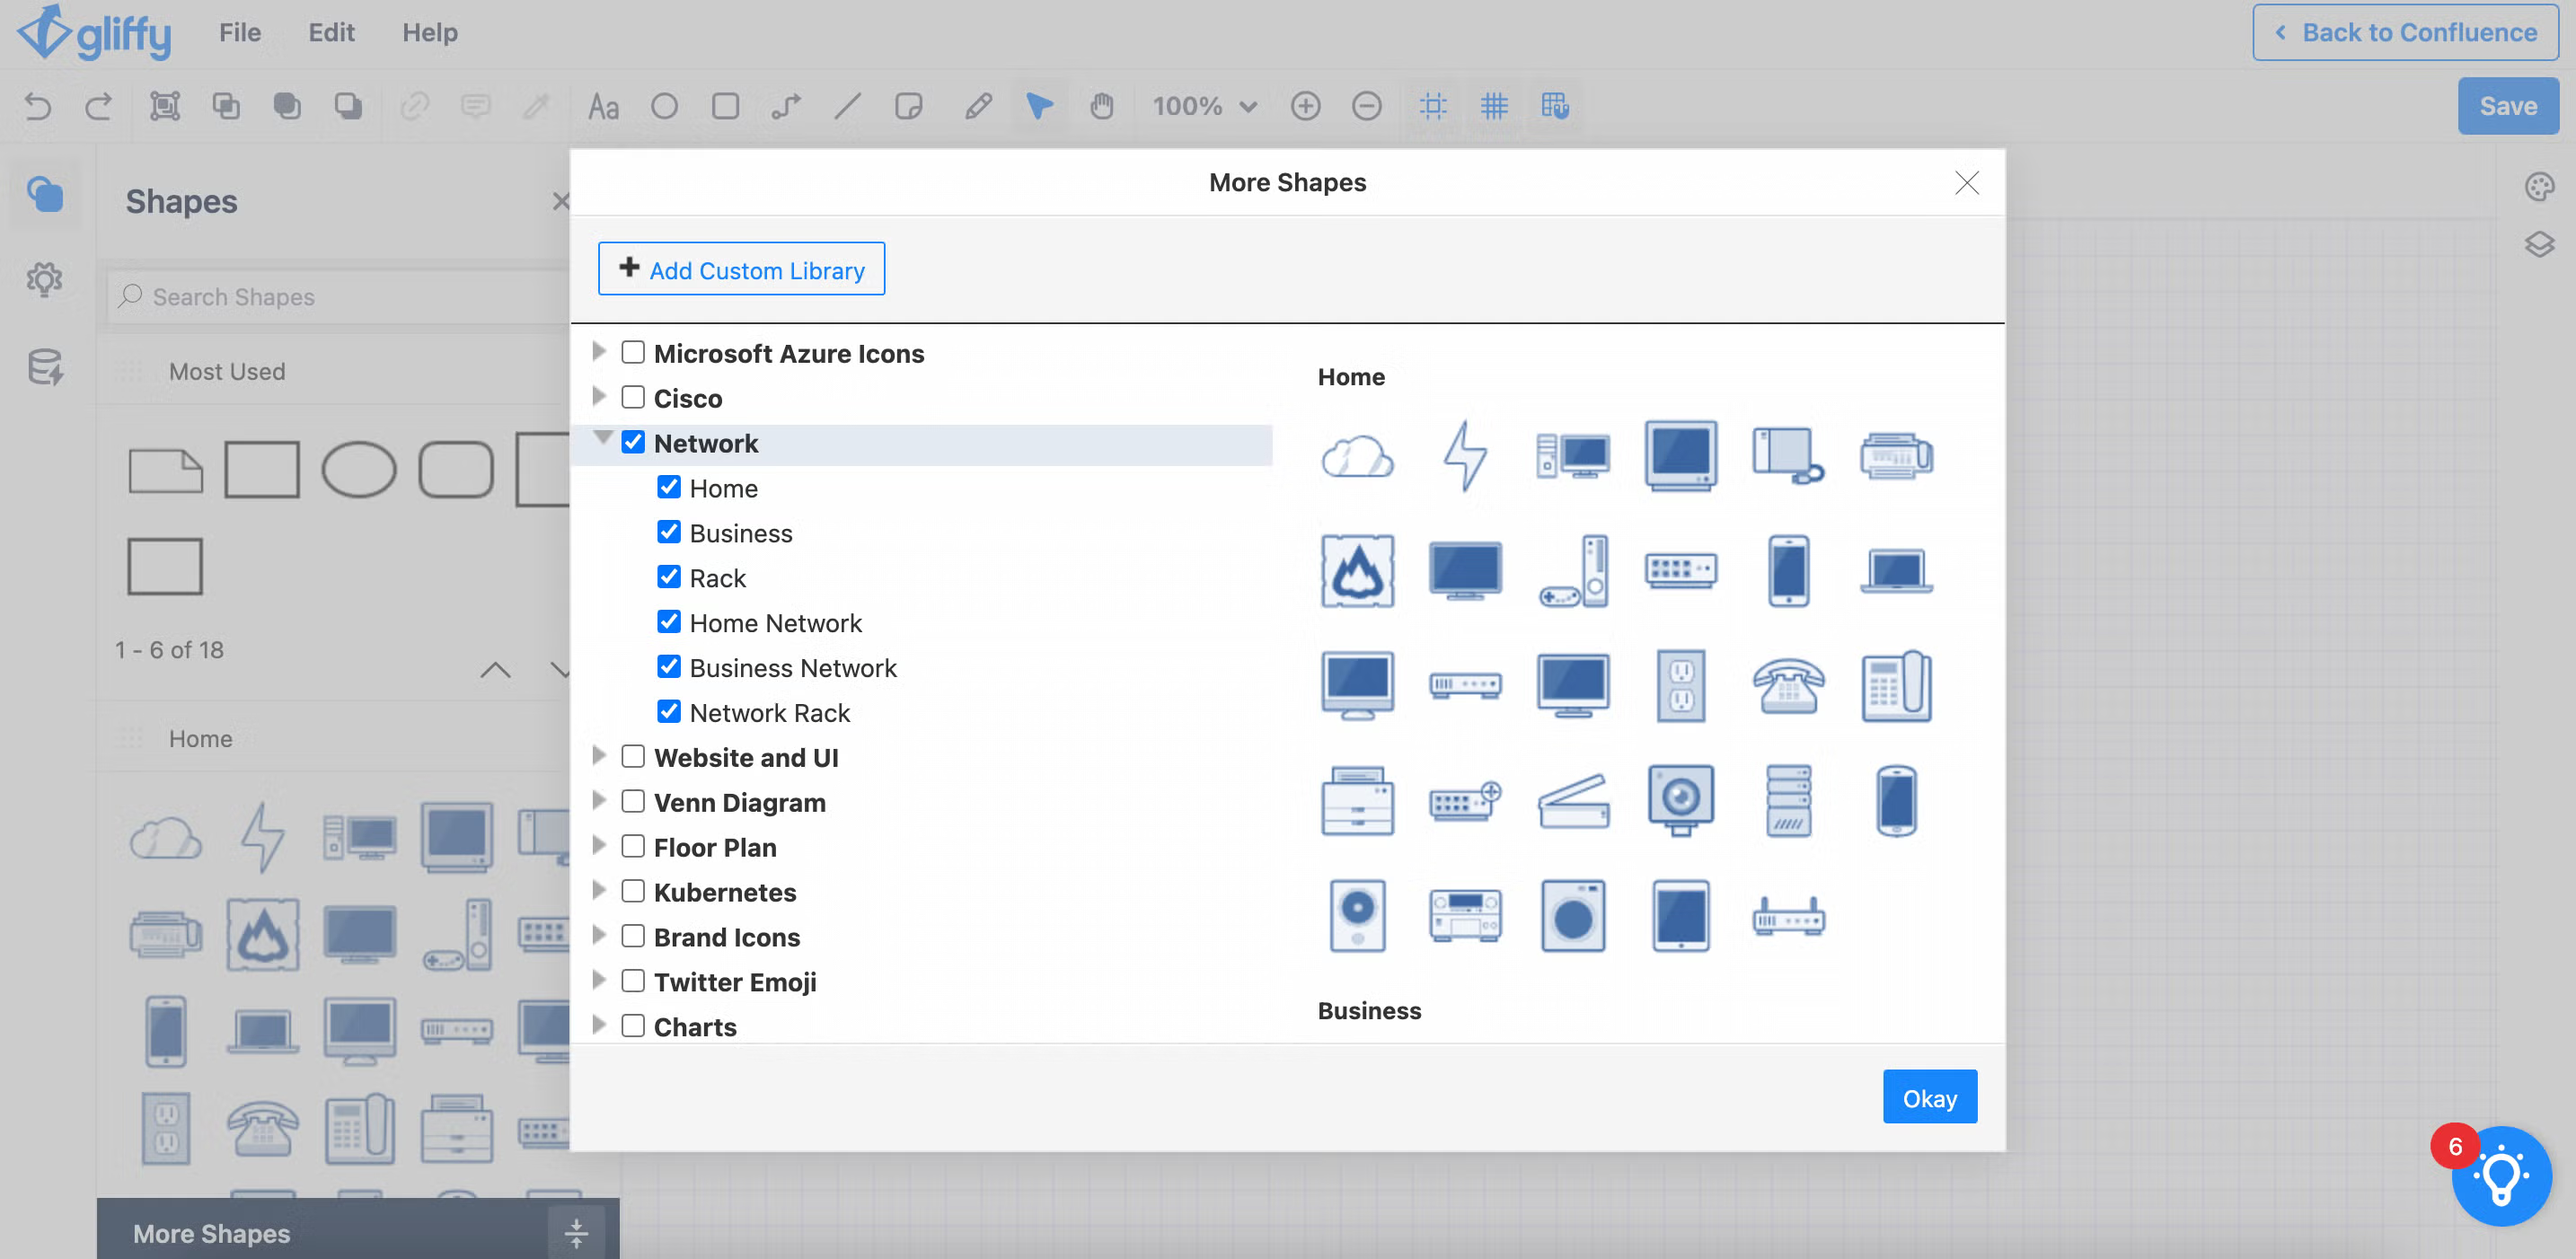
Some common network diagram symbols you will find in this shape library include:
- Servers
- Firewalls
- Terminals
- Routers
- Signals
- Cloud
You can hover over a shape in the shapes panel to see its name. If you can’t find a shape you’re looking for, you can use the search bar at the top of the shapes panel to search for it by name.
If you still can’t find what you’re looking for after searching, you can upload any custom image or logo by scrolling to the bottom of the shapes panel and clicking Add Images.
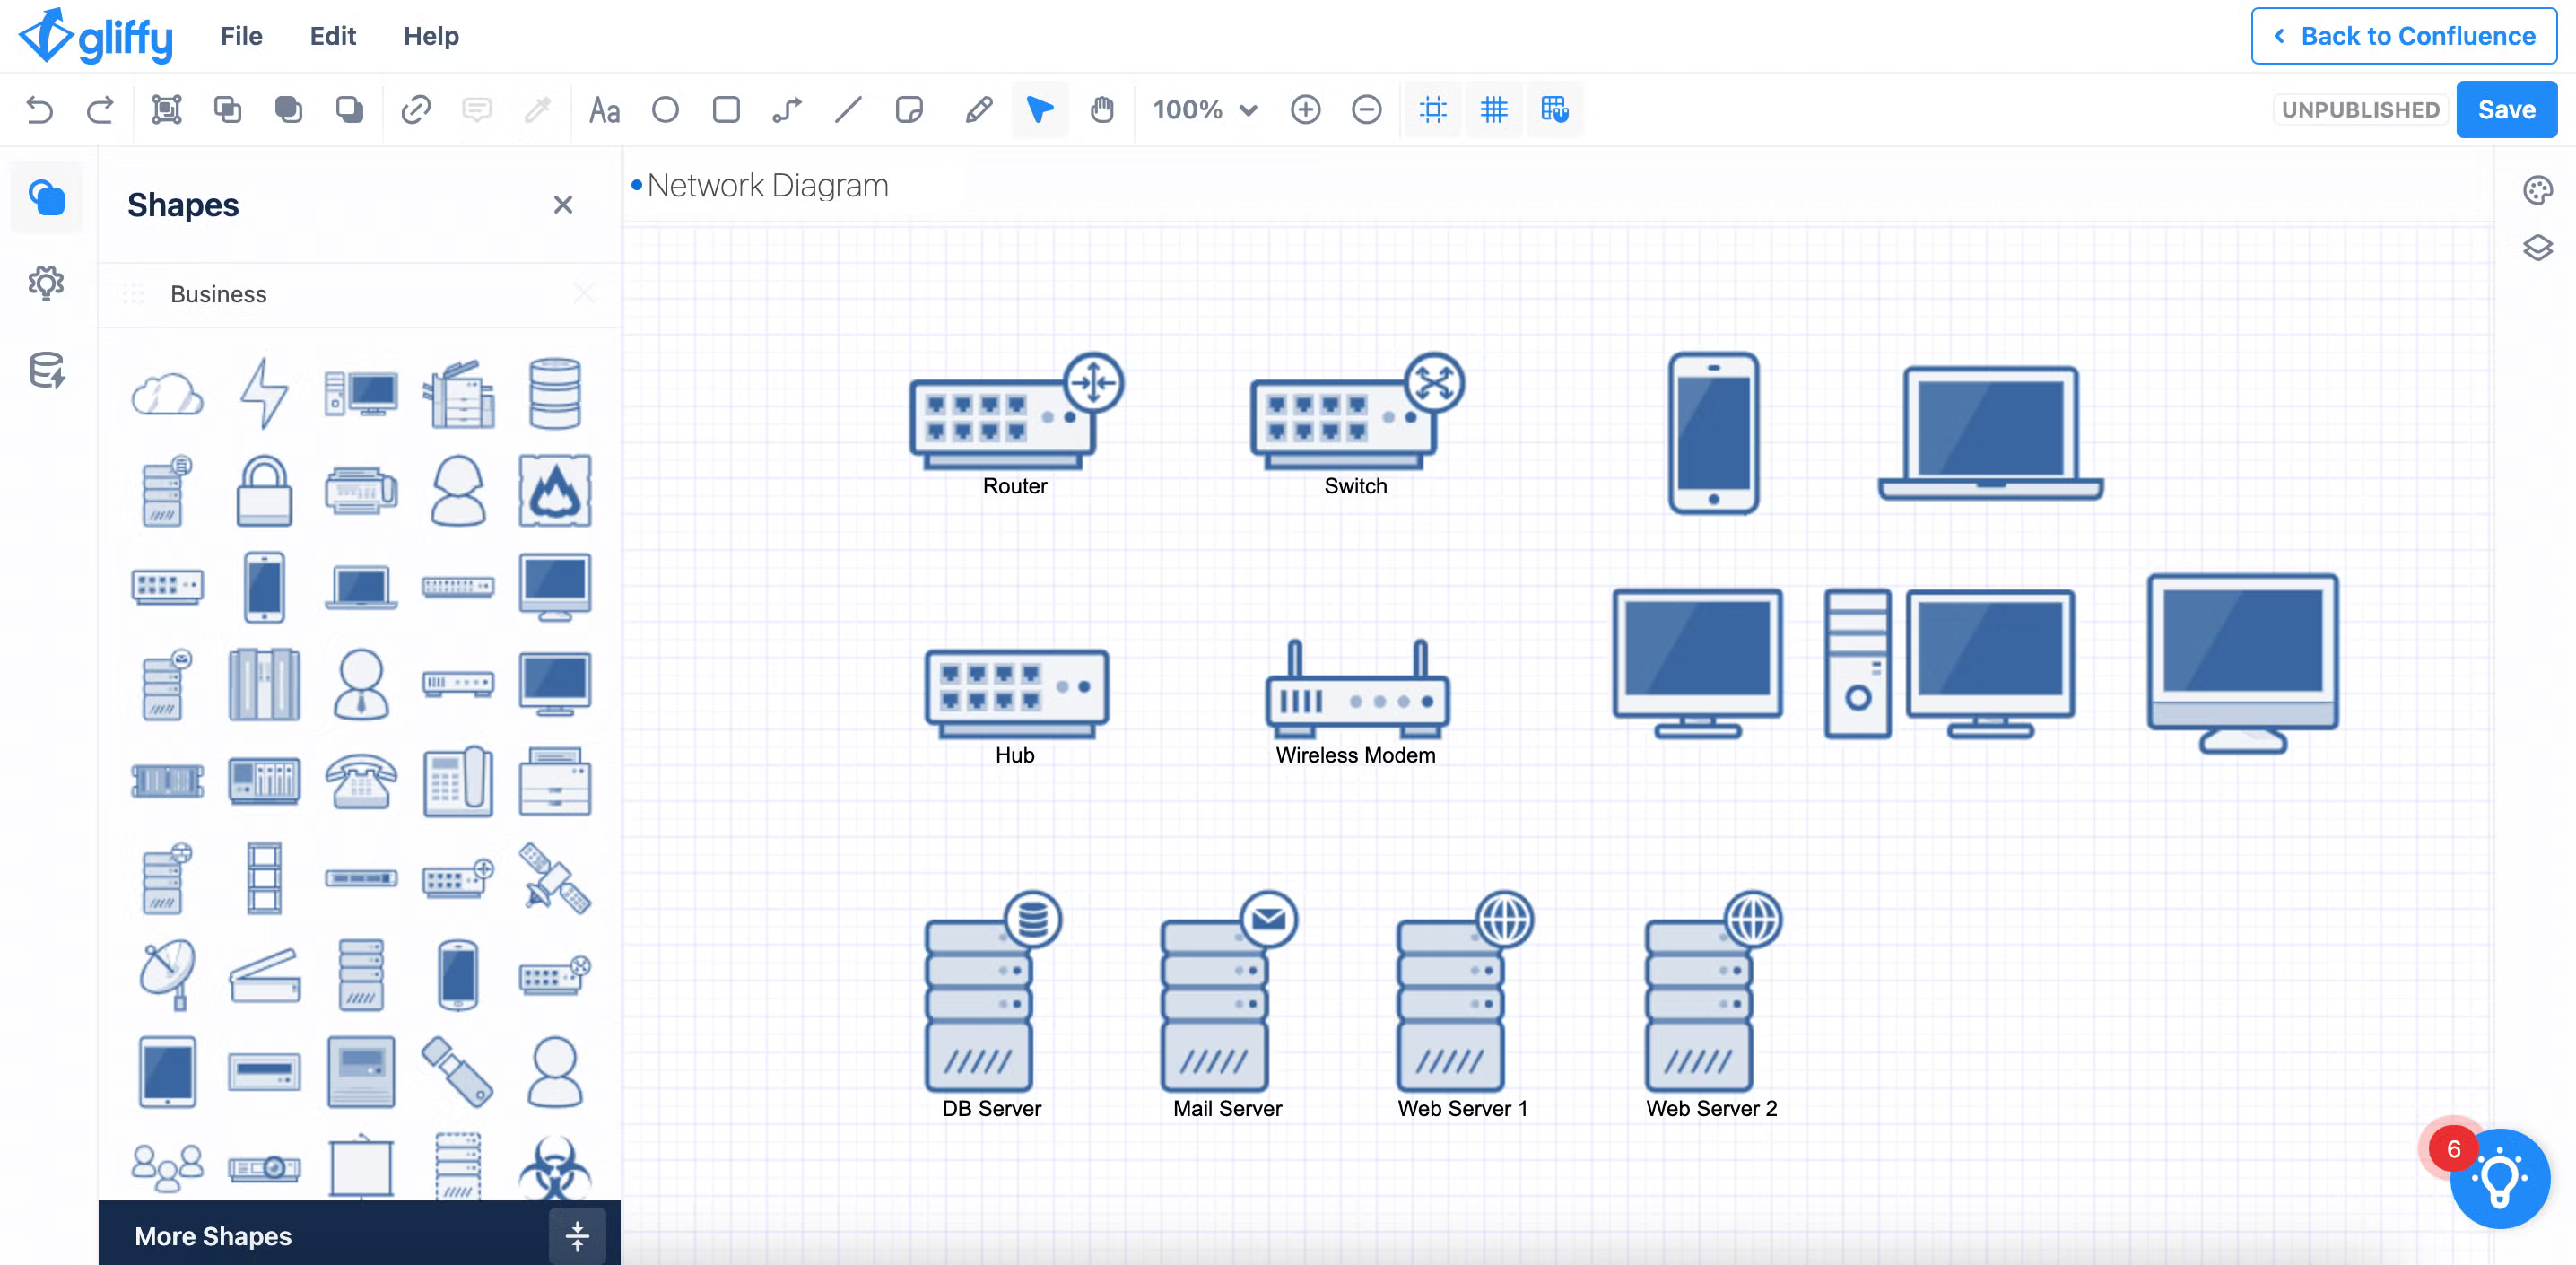
Add Network Components
Drag and drop all the devices, servers, and other components that will make up your diagram into the editor. As you add shapes, you can double-click on them to edit the text associated with it, helping you keep track of what each one represents.
Group and Organize Components
Once all your components are represented on the canvas, it’s time to start organizing them into a proper structure. This will make it easier for you to draw connections between them later.
If necessary, draw boxes or containers around components that go together, like wireless clients and wired clients, and use the Group button in the toolbar to group those shapes so you can move them together.
Gliffy Tip: Keyboard Shortcuts
Use CTRL + G (Windows) or CMD + G (Mac) to select multiple shapes and group them together.
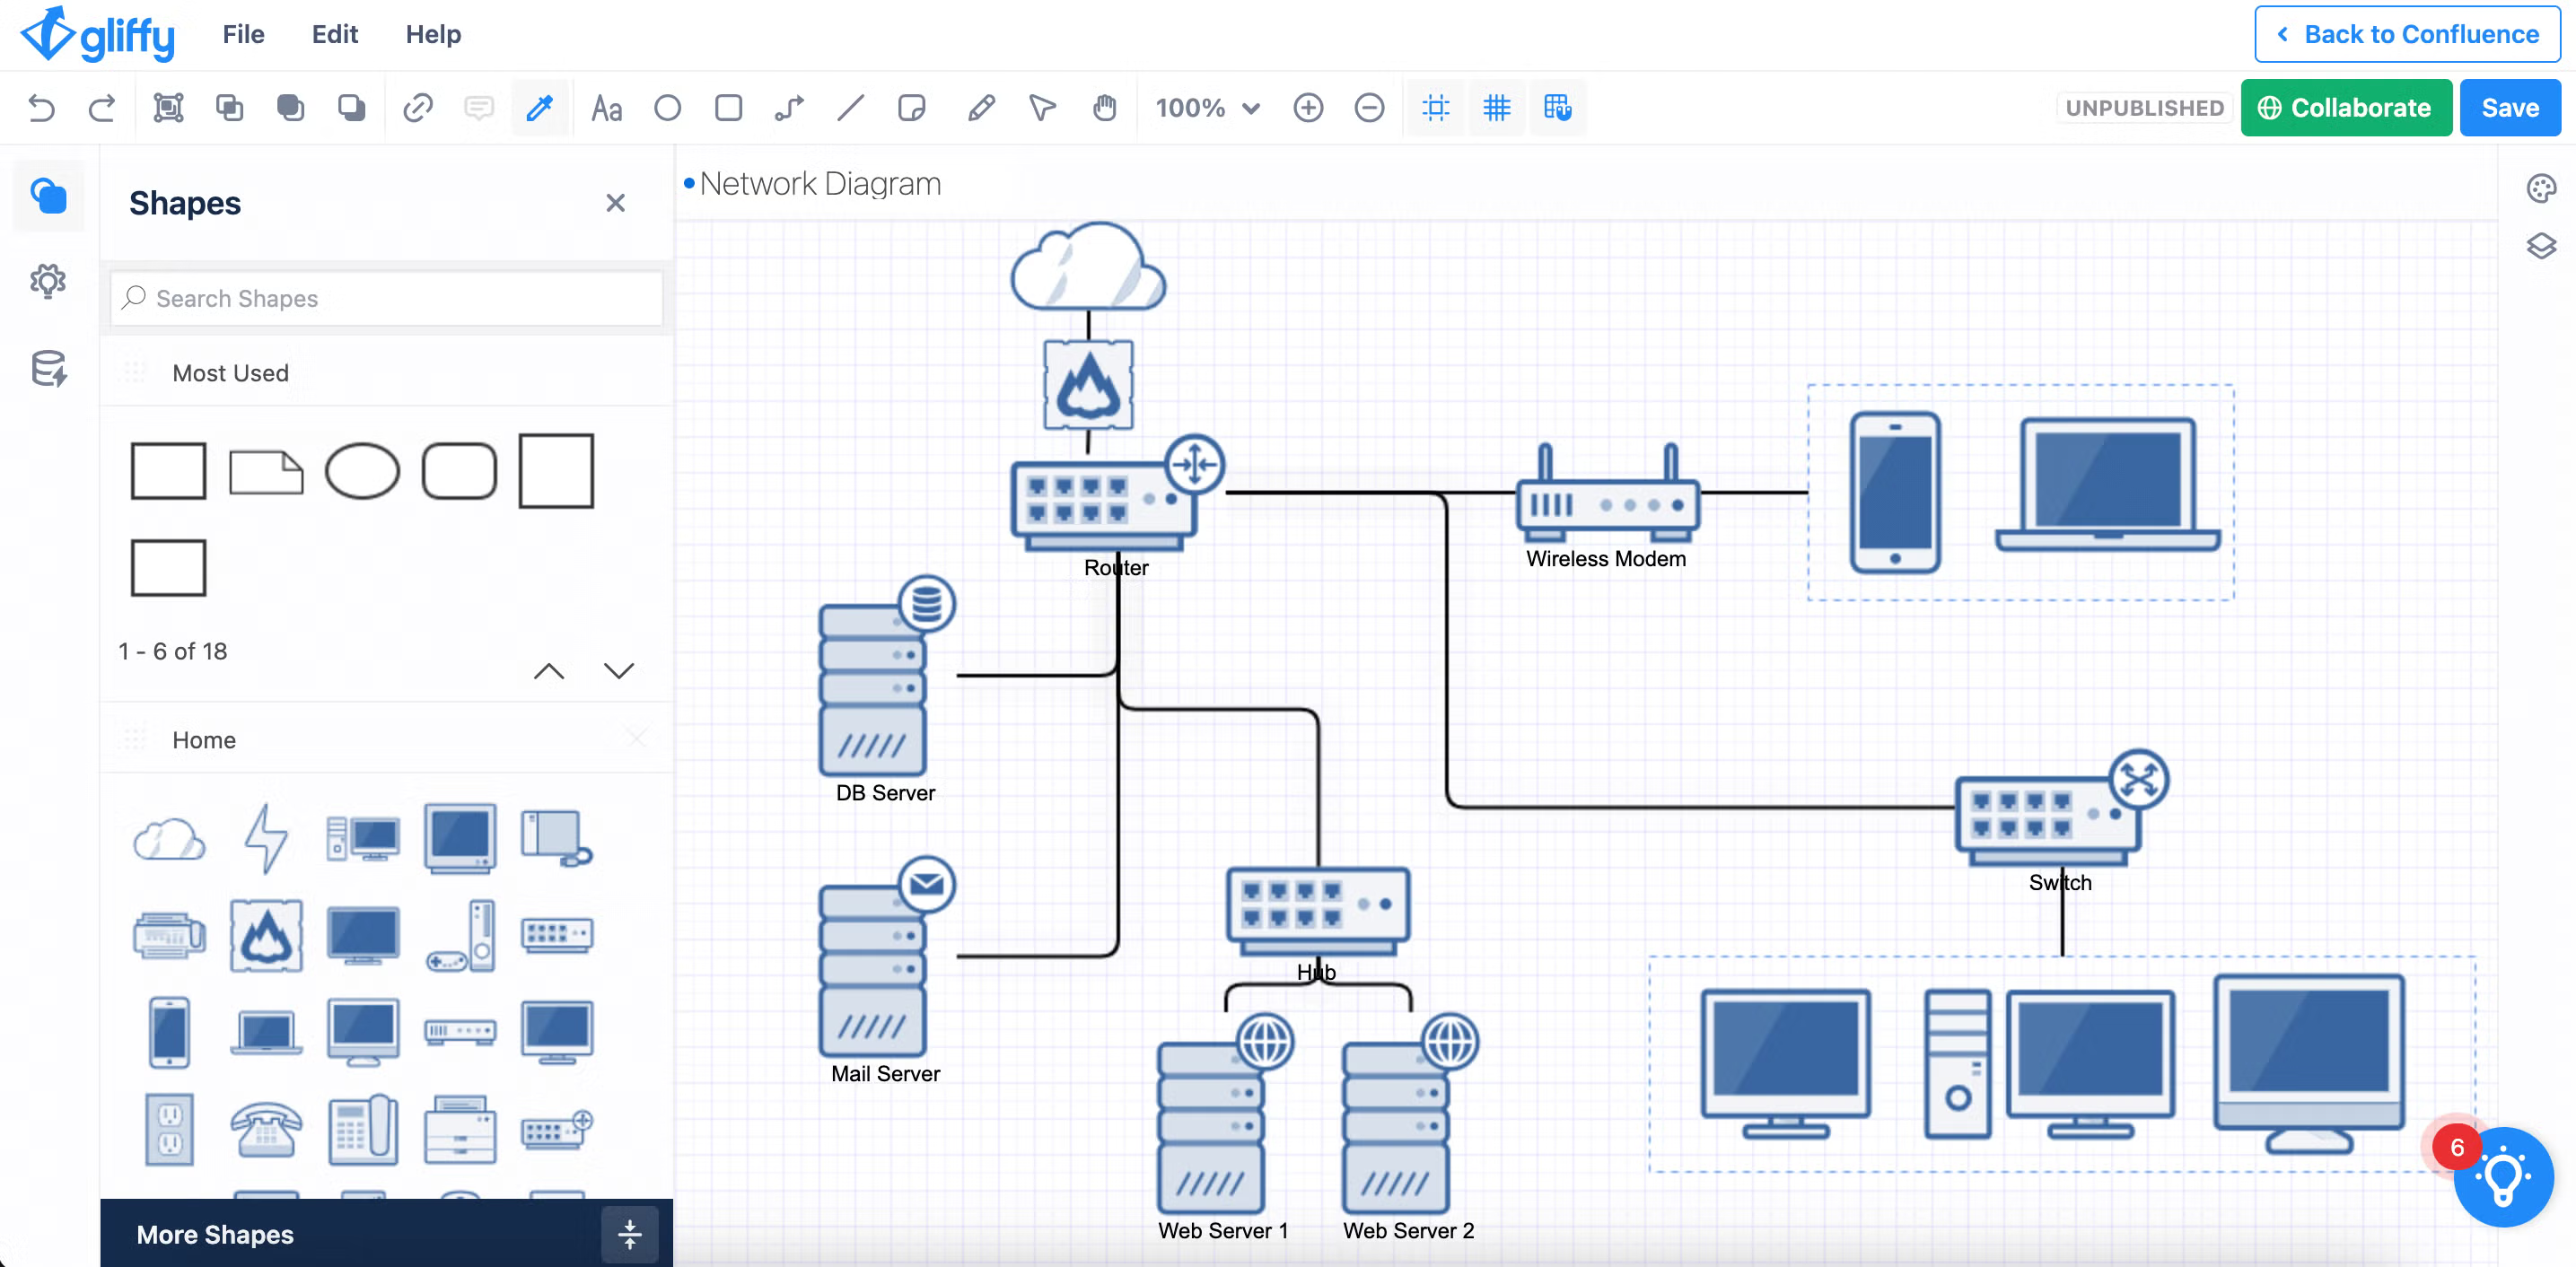
Draw Connections Between Components
Show how components are linked by using the Connector tool, which you can find in the toolbar at the top of the screen.
Hover over a shape until a green circle appears around your cursor, then click to drag a connector to another shape.
Draw connections and rearrange your components as needed to keep your diagram clean.
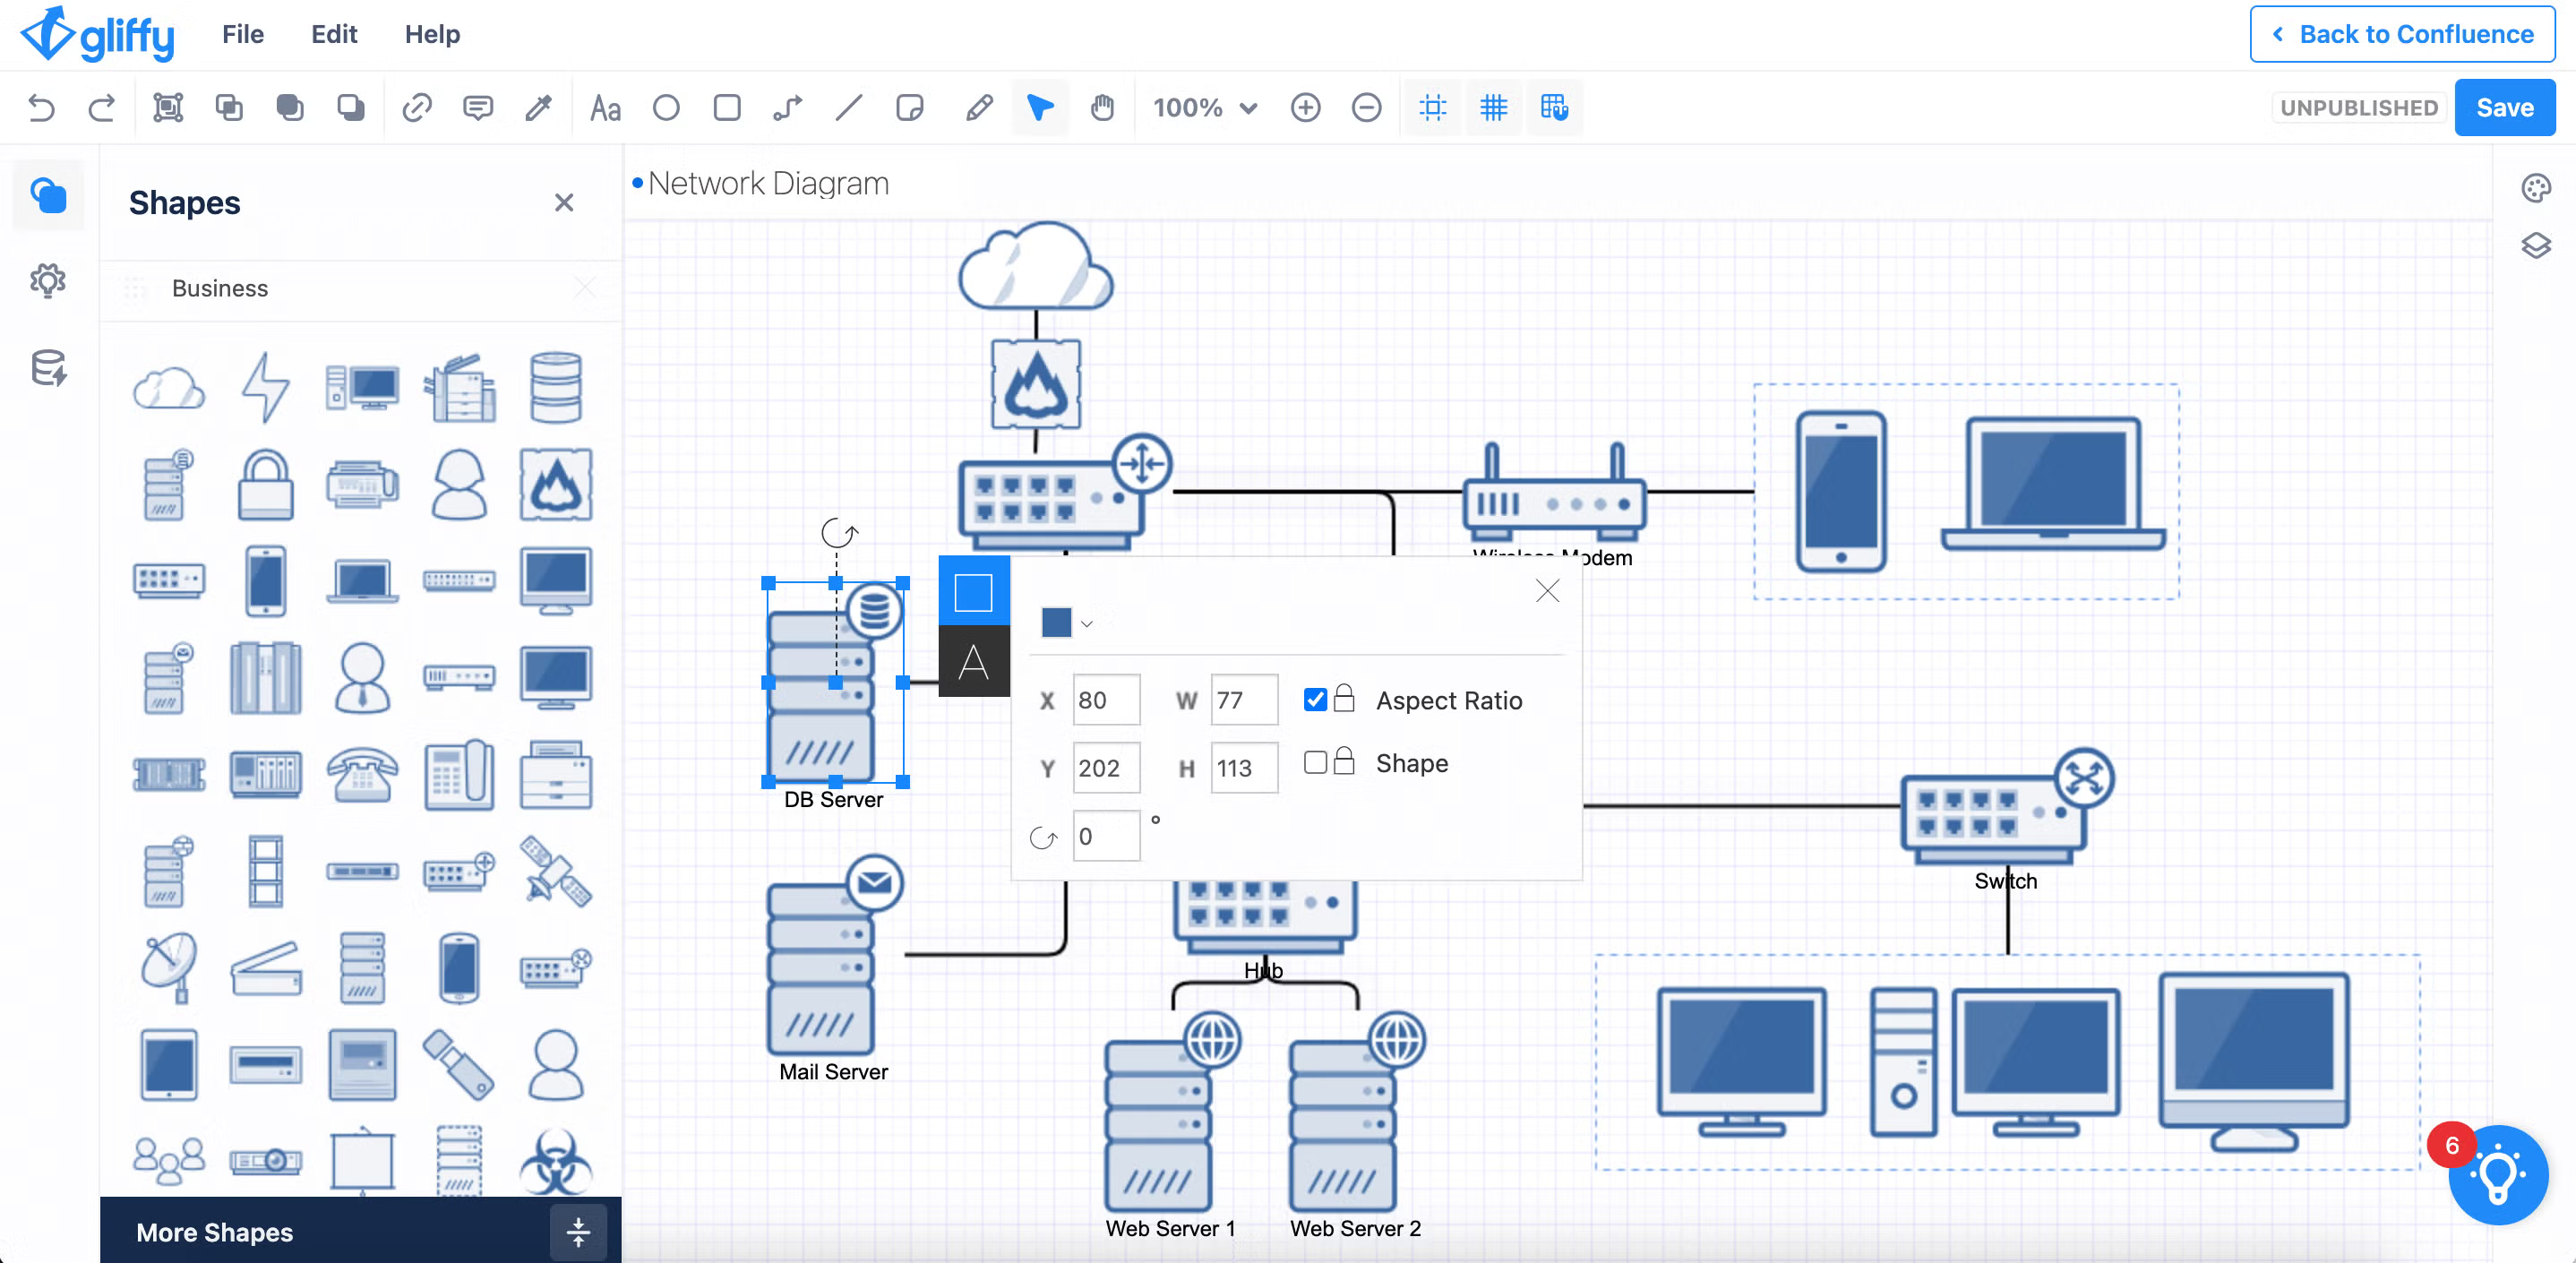
Style Your Diagram for Visual Hierarchy
Once the elements of your diagram are in order and connected, take a few minutes to edit the colors or line styles in your diagram to clarify the visual hierarchy between objects. For example, wireless connections can be represented with a dotted line while wired connections can be a solid line.
This can help make your diagram easier to read and understand at a glance.
To make these edits, click on the line or shape you’d like to edit, then click on the square or line icon that pops up to open the shape or connector editor.
Here are some additional resources to help you style your shapes and lines:
🎬 Video Tutorial: Using Lines & Connectors in Gliffy
🎬 Video Tutorial: Using Shapes in Gliffy
Share Your Network Diagram
Give your diagram a title, click Save, and go back to Confluence. You’ll find your diagram on the page, and you can either share the link to the page or to the diagram itself with your team.
Back to top
Try Gliffy, Your Network Diagram Tool for Confluence
Network diagrams are an important part of IT management, from documentation to maintenance. By using Gliffy to create your IT diagrams, you can create and store all your network information in one location, helping your team find what they need when they need it.
Start your free evaluation of Gliffy for Confluence to build your own network diagram today. Want updates and tips? Sign up for the Gliffy newsletter to stay in the loop.