When you’re organizing information, especially if you need to share it with others, you’ll want to make sure it’s structured in a way that’s easy to understand at a glance.
A bulleted list is a perfectly fine way to meet that need, but what about when you want something a little more eye-catching?
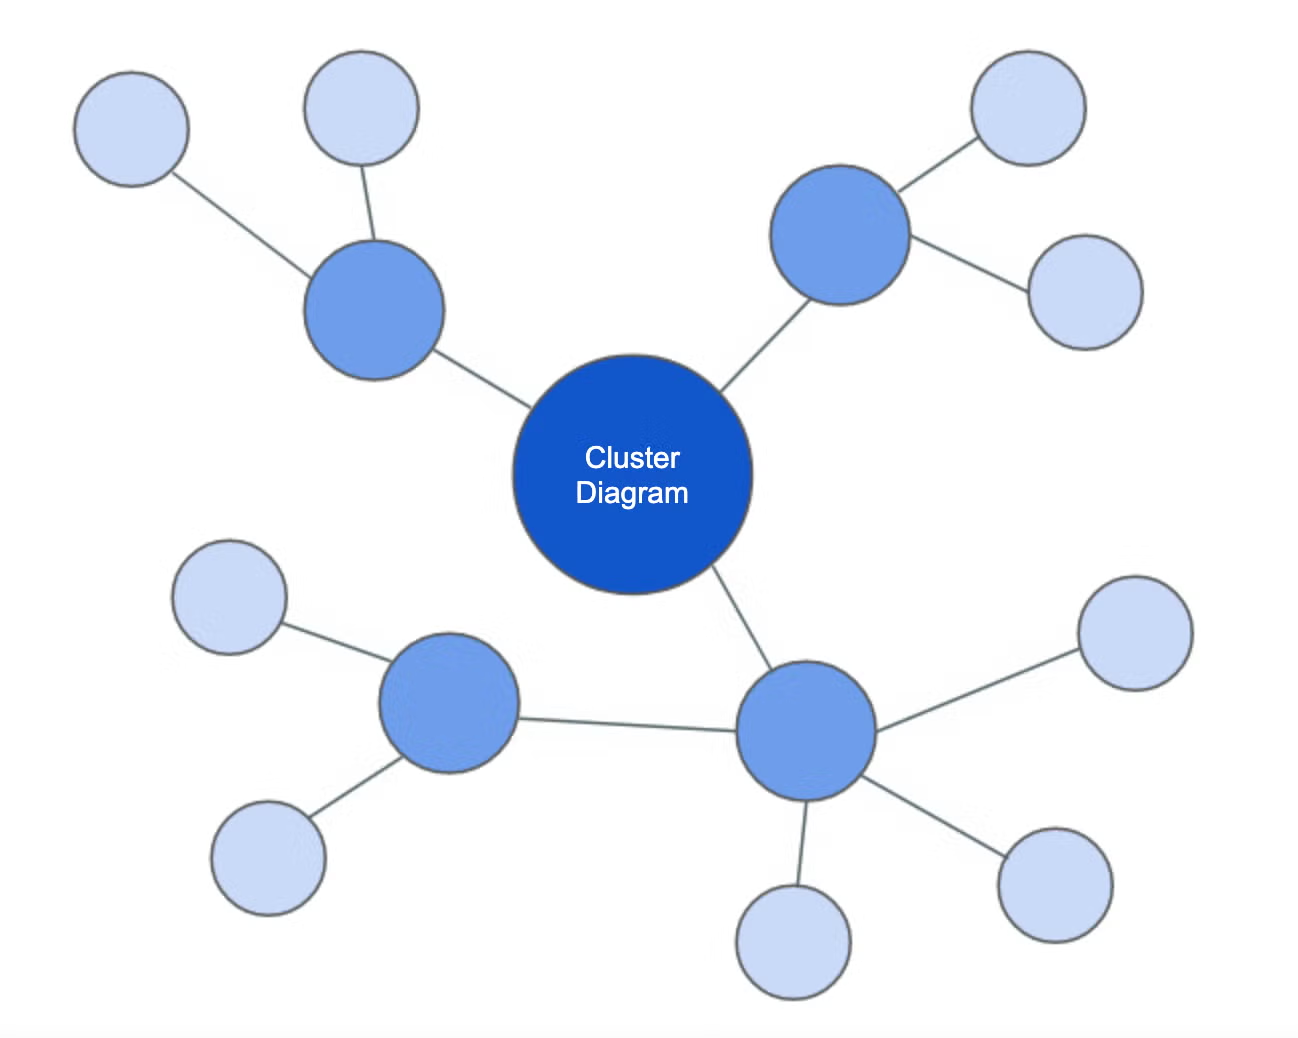
With a cluster diagram, you can visualize groupings and hierarchies of information and make your ideas more engaging.
Keep reading or choose one of the following sections to learn more about cluster diagrams and how to make your own.
What is a Cluster Diagram?
In general, a cluster diagram displays clusters—or groups—of information, objects, or ideas. It’s a visual tool for organizing these things by their common factors.
However, the term “cluster diagram” can actually refer to a few different kinds of specific diagrams.
Cluster Diagrams for Network Documentation
One type of cluster diagram is a technical diagram that shows networks, systems, and architecture. These diagrams can include visualizations of the network topology as well as other aspects of the network.
If you’re creating this type of diagram, you’ll want to visit our blog, How to Make a Network Diagram, for a more detailed tutorial and key tips.
Cluster Diagrams for Brainstorming
The more common form of a cluster diagram is used for brainstorming. It can either be used as a brainstorming technique itself or a way to organize ideas after brainstorming.
It’s similar to a mind map—both start with a central theme or idea and branch out from there, with the information and ideas becoming more detailed as more branches are added.
If you’re interested in creating this type of diagram, keep reading! Not only will we guide you through all the steps you’ll need to know, we also have a pre-built template that you can launch to start diagramming now.
Back to topCluster Diagram Template
When you build your cluster diagram in Gliffy, it’s quick and simple to fill out and expand our template as needed. Add as many branches as you need to record and organize all your ideas.
Never used Gliffy before? No problem! With an easy-to-learn interface and intuitive mind mapping functionality, you’ll be diagramming like a pro in no time.
 Back to top
How to Make a Cluster Diagram
Want to lead a brainstorming session with your team and make a cluster diagram throughout the process, or organize the great ideas from a recent brainstorm? Read on to learn the steps.
Step 1: Start With a Theme
This will be the theme that guides the rest of your diagram. For example, if you’re discussing a new product or feature idea, make that the center of the diagram. Or maybe you’re reviewing the results of a recent customer survey—something like “customer feedback” can work as a central idea, too.
Step 2: Create Subcategories
What are the subcategories you’ll use to organize your ideas? Think of at least a few that you can branch off from the main idea. These will help you know where to place the more specific details as you get further into the diagramming process.
Step 3: Fill Out the Branches
Add ideas and information under each subcategory to fill out your diagram. You can go as deep as you need to—if your subcategories need their own subcategories, go ahead and make them. One of the advantages of cluster diagrams is their flexibility, so don’t be afraid to structure yours in whichever way works for you.
Step 4: Customize!
Add the finishing touches to complete the diagram. If any additional photos or labels would be helpful for your or your team’s understanding of the diagram’s content, you can add those right to the canvas. Or, if you’re looking to add a little creative flair, you can color-code parts of the diagram by subcategory or by level of hierarchy.
Back to topCreate and Share Your Cluster Diagram
Did you know that Confluence pages with more visuals tend to get more engagement? It’s true! An eye-catching diagram is the perfect addition to a page—check out some of our other tips on how to make the most of your Confluence pages.
If your team uses Confluence, you can create your cluster diagram directly in a Confluence page and publish it for everyone to see.