Azure architecture is the way an organization uses Microsoft’s Azure products and services to build, run, and manage applications.
The infrastructure of Azure cloud applications for an organization is often described using a diagram because that is an easier way for technical and non-technical users to understand.
Azure architecture diagrams often describe these components:
- Azure Services
- Configuration
- Networks
Why Make an Azure Architecture Diagram?
The more complicated your Azure cloud infrastructure is, the more visualization helps you communicate details about your structure and plan for change.
Cross-Functional Communication
Azure diagrams allow technical and non-technical users to understand the technology that supports their day-to-day work.
Troubleshooting
Having documentation is valuable when you encounter network or system issues – especially visual documentation that helps you understand the relationships between elements of your network or system at a glance.
Planning Ahead
Azure diagrams can help you plan for and execute changes to your enterprise cloud strategy to stay ahead of your organization’s technical needs.
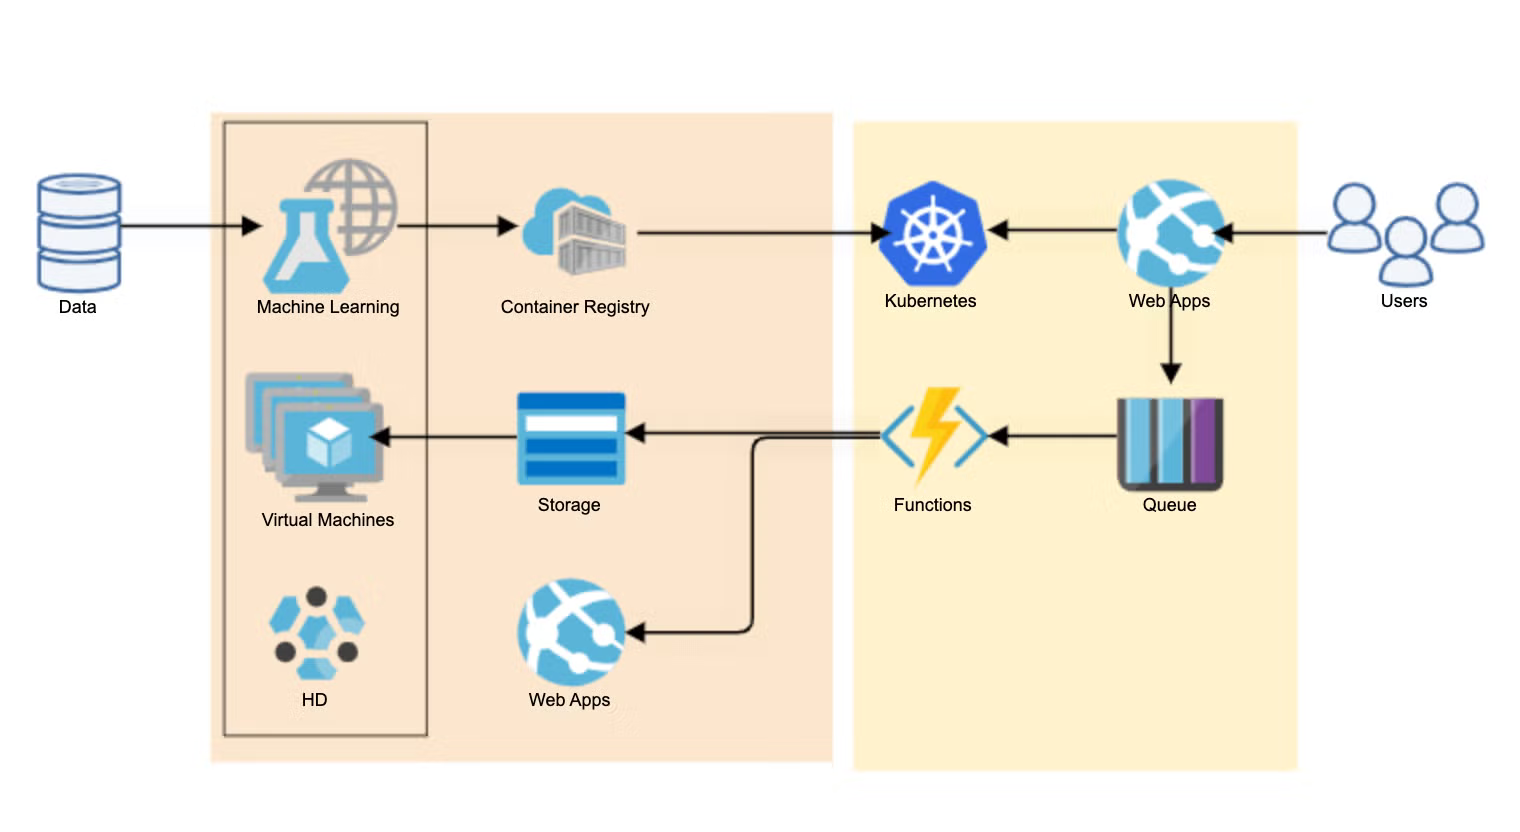
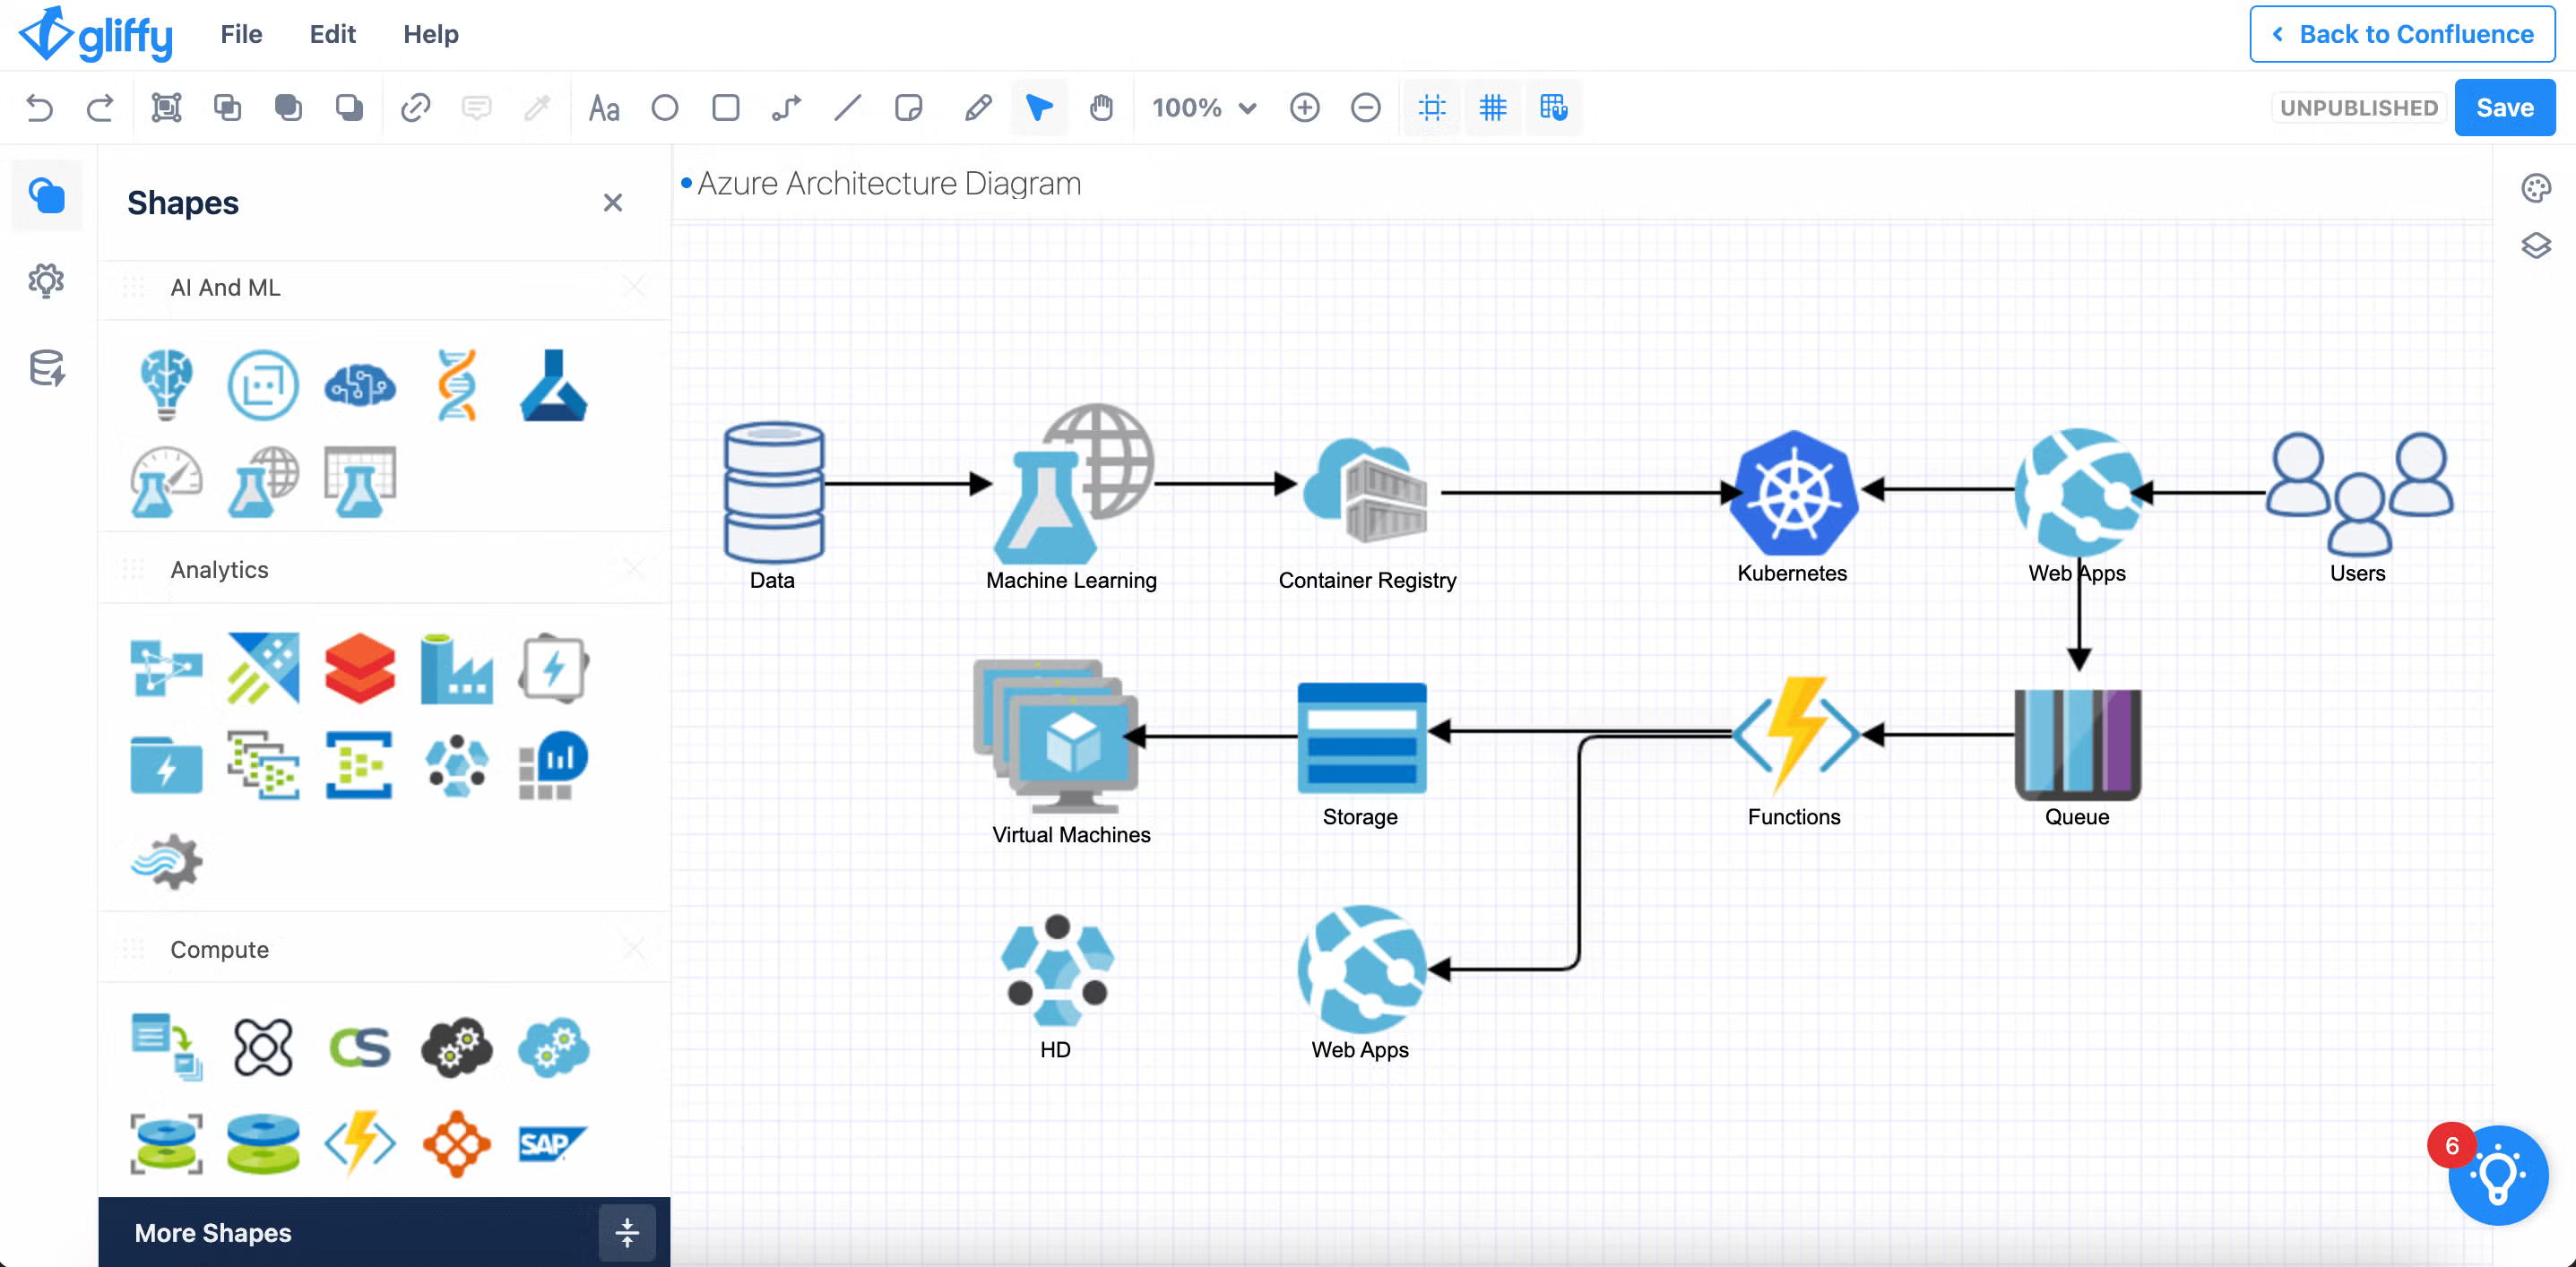
Azure Architecture Diagram Example
 Back to top
Video: Azure Diagram Tutorial
How to Draw Azure Architecture Diagrams
To follow along with this Azure diagram tutorial, make sure you’ve started your free eval of Gliffy.
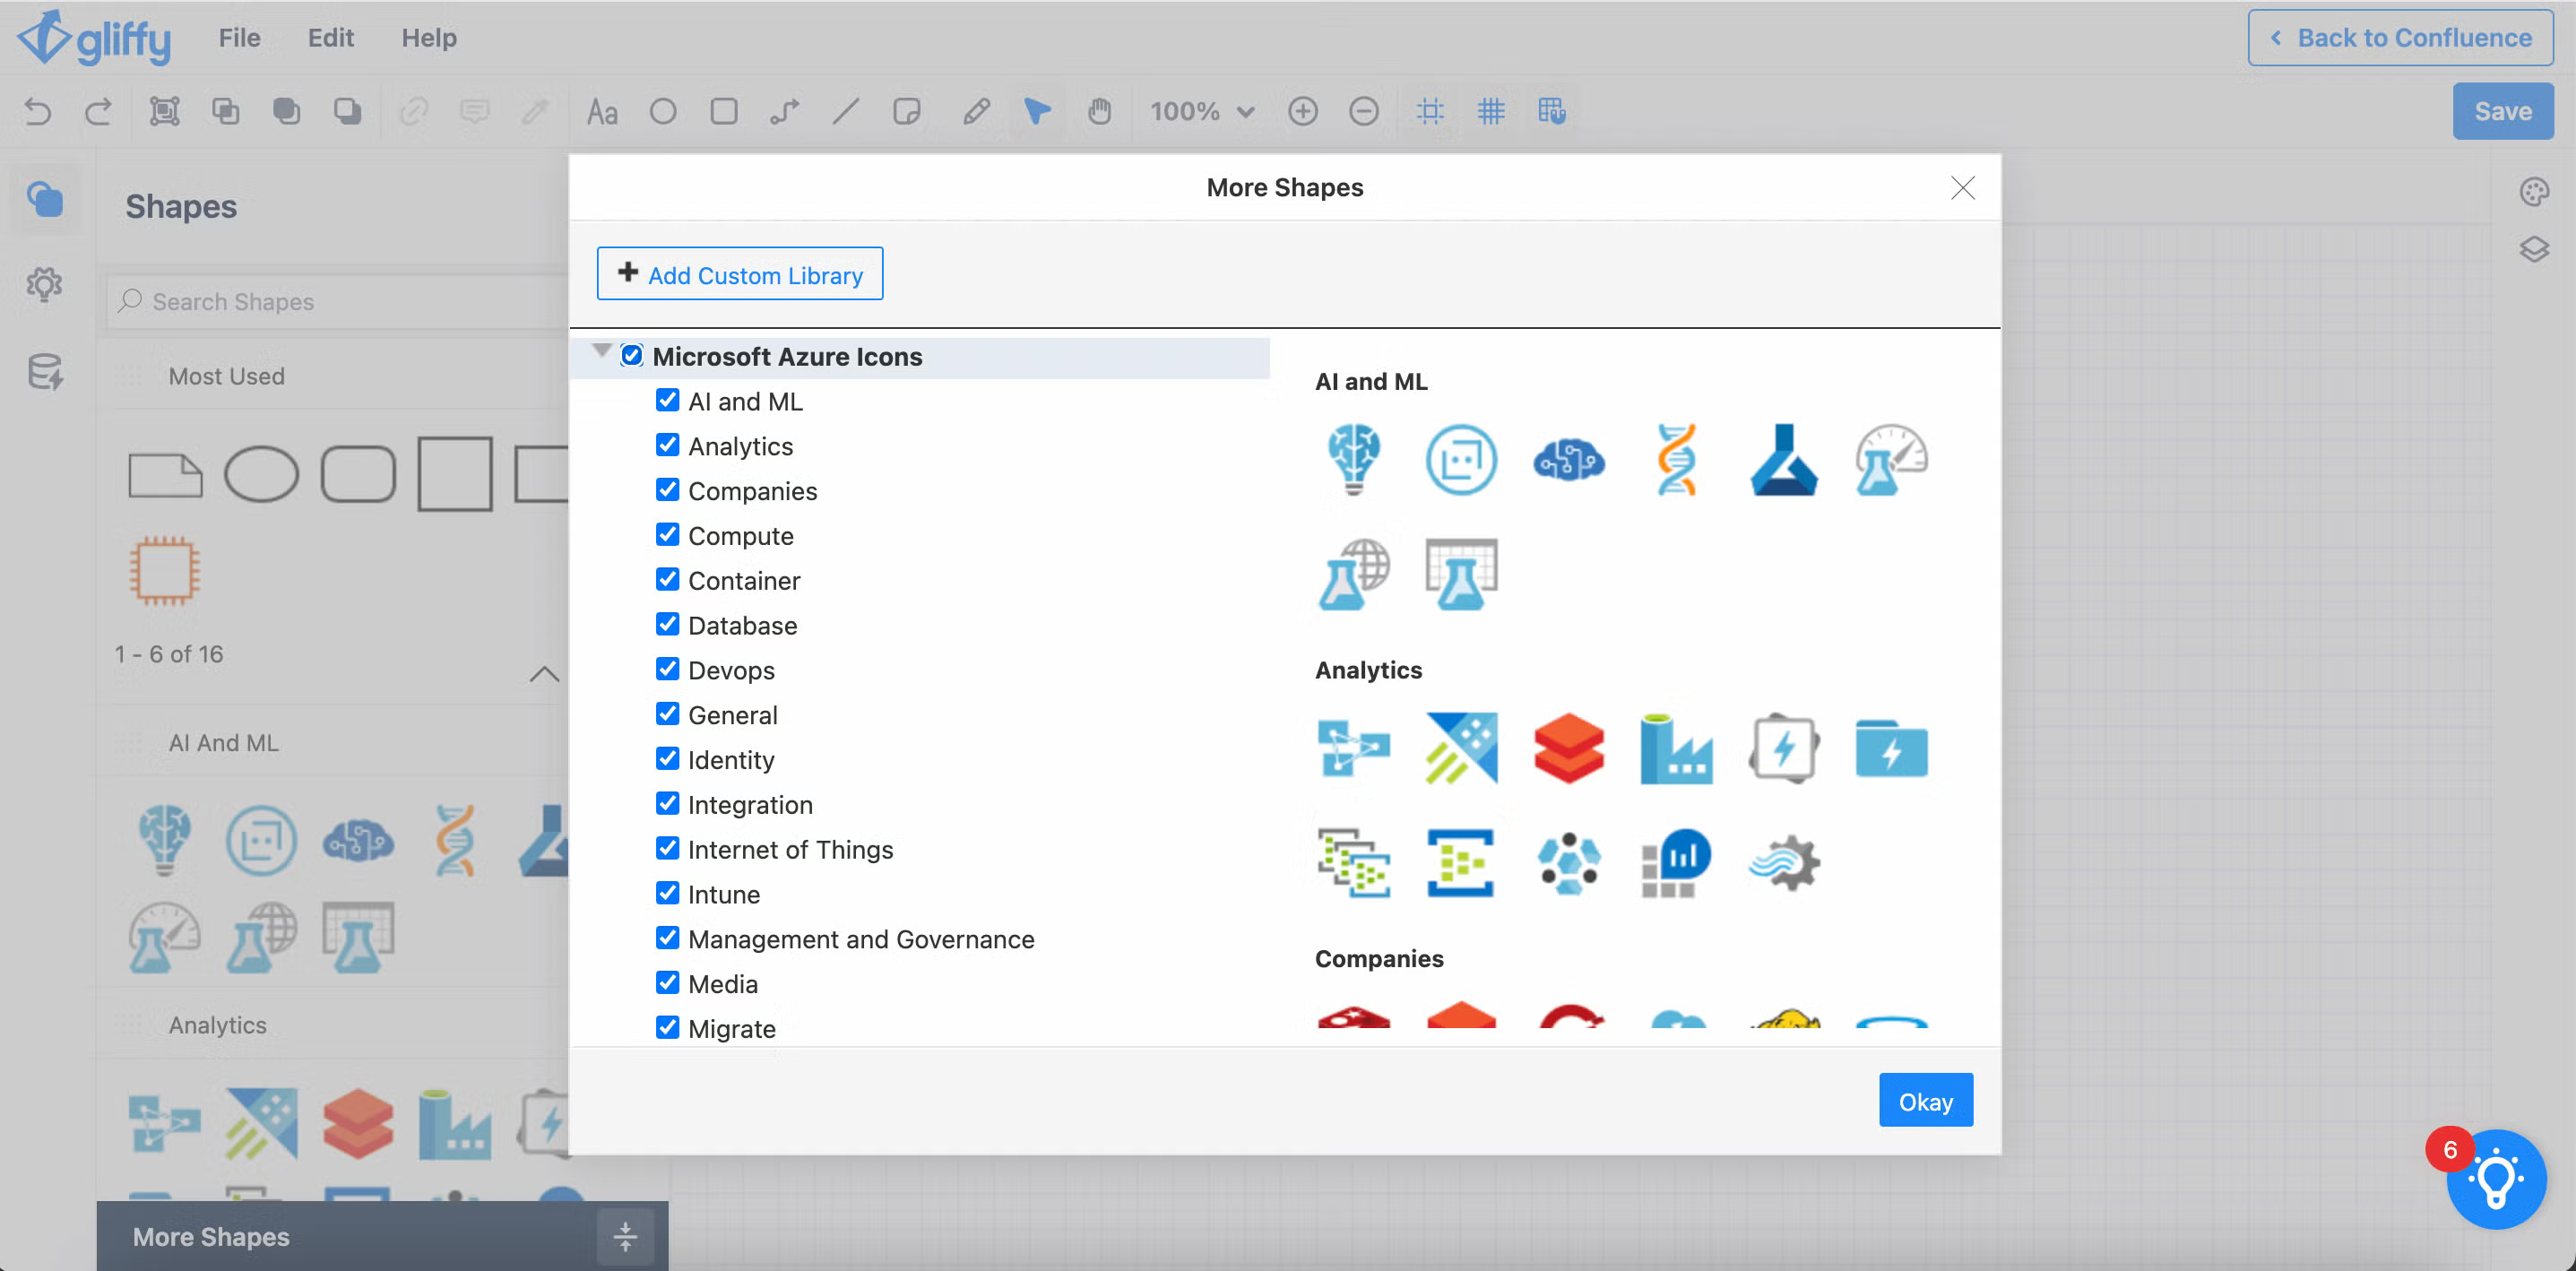
Add Azure Icons
First, open a new Gliffy diagram and click “More Shapes” at the bottom left corner of your screen.
Then, make sure “Microsoft Azure Icons” is selected. After that, you’ll see the Azure shape library in the shapes panel on the left side of your screen.
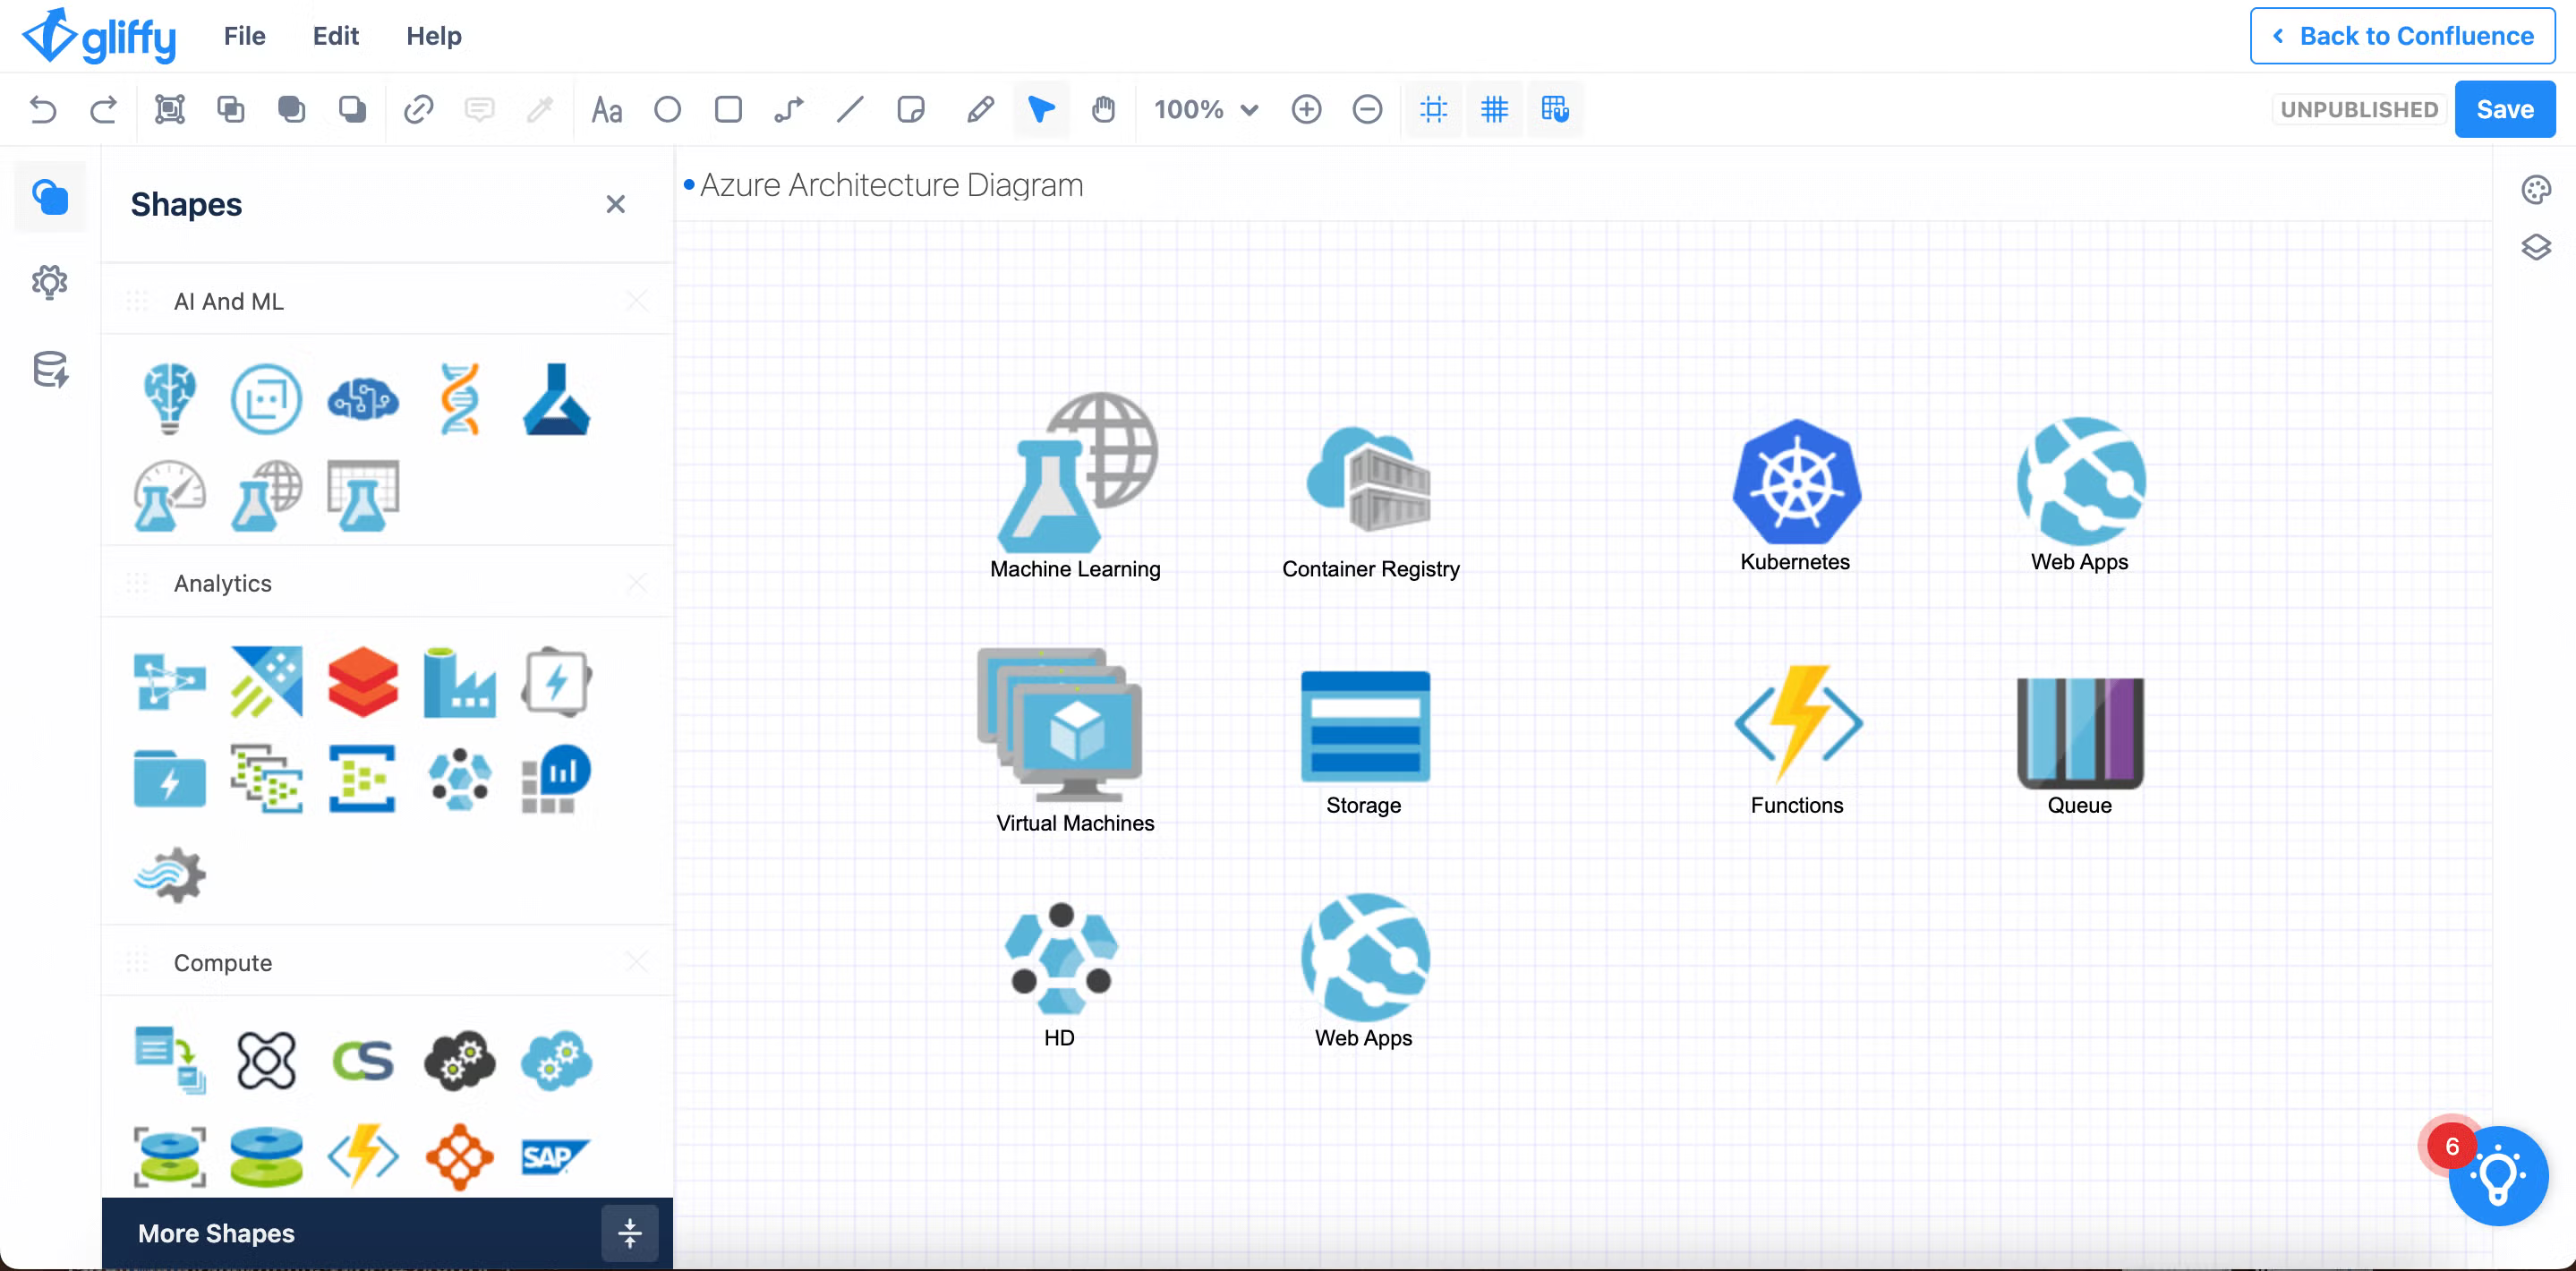
Add Your Azure Services
Add the icons that represent your Azure services to the diagram canvas. You can use the search bar in the upper right to quickly find the shapes you need.
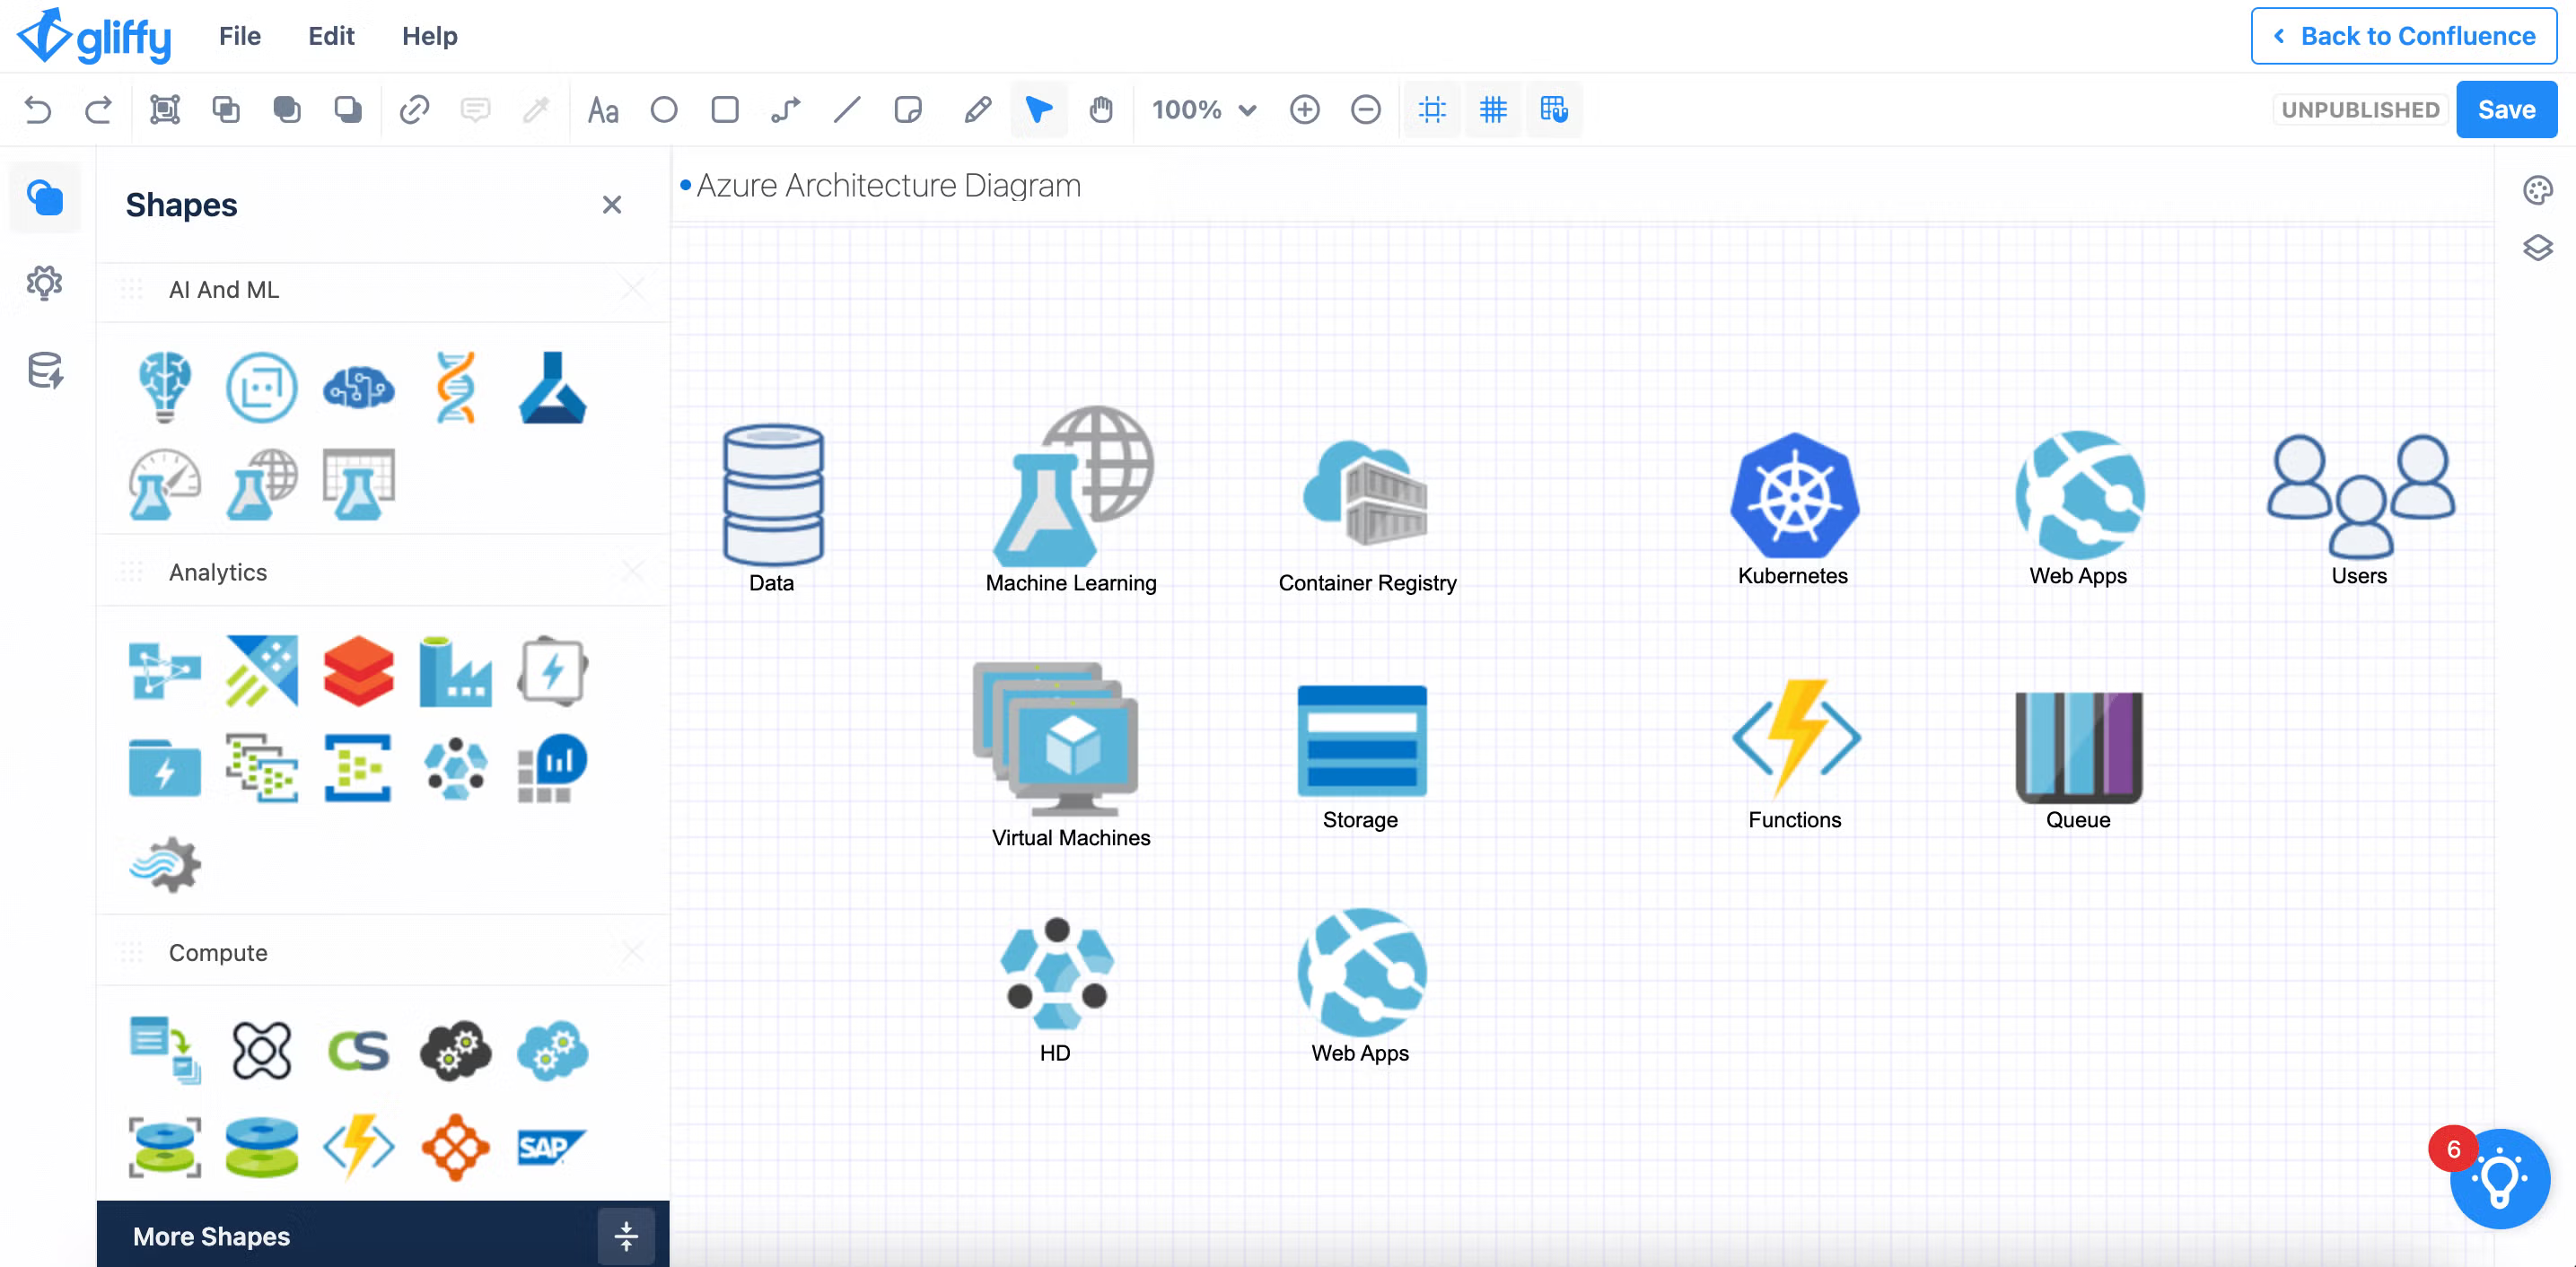
Add Other Networking Shapes
You might want to include some details that aren’t part of the Azure shapes set to describe other parts of your network outside of the Azure cloud.
For example, you might want to add an icon representing end users or the data entering the system. You can find additional shapes in “More Shapes” and add any additional libraries from there. You can also upload your own custom shapes or icons for details specific to your organization.
Draw Relationships
Use Gliffy’s connector tool to drag and drop lines between shapes. If information interacts with a group of tools or services that perform around a similar function, it might be helpful to draw a box around those shapes and connect the arrow to that box rather than to each service icon individually.
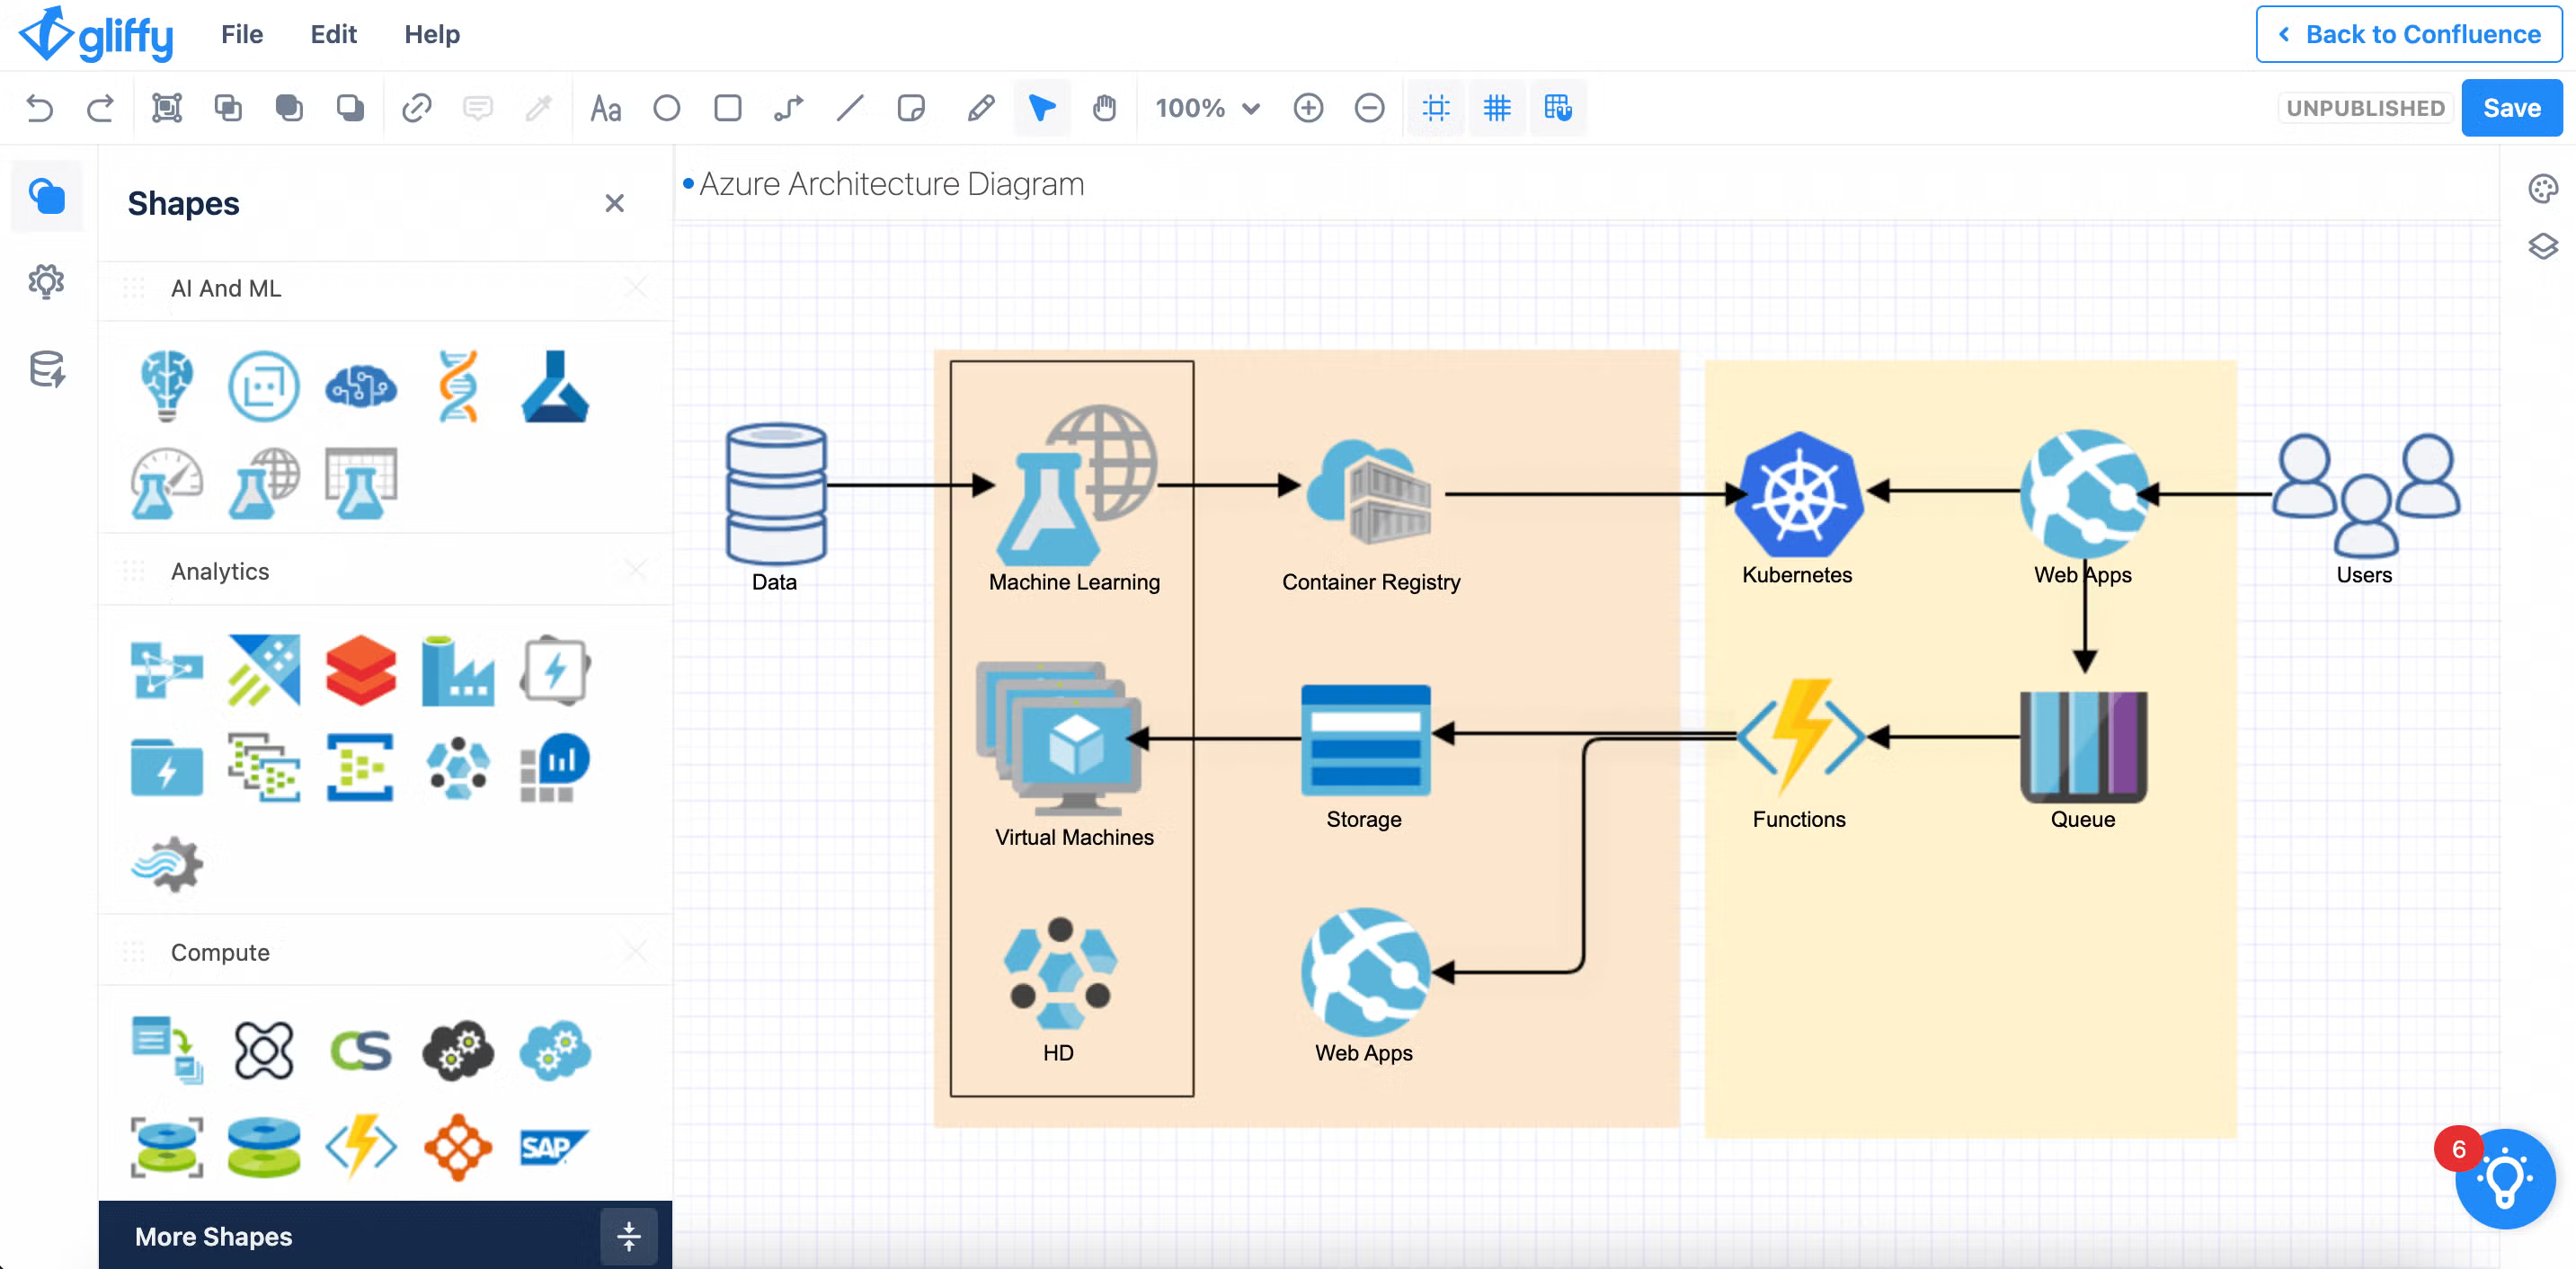
Create Sub-Sections
In some cases, it can be helpful to draw boundaries that describe what takes place within your instance. For example, you may want to illustrate separate zones for what is taking place within Azure and for the services in a stack. You can show these different zones by drawing rectangles around those sections.
After drawing your rectangle around an area, right-click and select “Send to back” so it goes behind your Azure and networking shapes. You can edit the shape's color, opacity, and more by clicking the square icon that appears when you select the shape.
To learn more about the shape properties panel, visit our blog on customizing shapes and connectors in Gliffy.
Save and Share
Give your diagram a name and save it so your team can view it directly in Confluence!
Whenever you update your diagram, it will automatically update wherever you have placed it throughout your Confluence space, so no one on your team needs to reference outdated information.
Create Your Own Azure Architecture Diagram
To create your own Azure architecture diagrams, start your free evaluation of Gliffy for Confluence Cloud.
Gliffy is packed with features for software and IT teams, so when you sign up for a free trial, you’ll also be getting an easy way to make UML diagrams, database diagrams, C4 models, and more.
Want to be an expert on all things architecture diagramming? Check out our complete guide to cloud architecture diagrams.