Making confident, well-informed decisions is essential for success in any field, whether you’re managing complex business operations, tackling IT service challenges, or designing machine learning algorithms.
A decision tree can help you accomplish this. It’s more than just a diagram; it’s a powerful tool that organizes choices, visualizes possible outcomes, and ensures consistency in your processes. Think of it as a structured roadmap that simplifies even the most intricate decisions, empowering teams to act with precision and confidence.
This blog will explore the value of decision trees in business, IT, and more, and guide you through the steps you’ll need to create your own.
Decision Trees vs. Flowcharts: What's the Difference?
Decision trees can be considered a type of flowchart because both kinds of diagrams are for visualizing processes, but decision trees exist for a more specific use case.
While flowcharts describe the tasks involved in a process, which could include multiple decisions along the way, decision trees are for a single decision or classification. They are made up only of conditions that guide the viewer through that decision.
So, while you could certainly refer to your decision tree as a flowchart, not all flowcharts are decision trees.
How Decision Trees Benefit Process Flows
Decision tree analysis allows you to visually map out possible outcomes and guides you toward the choice that makes the most sense for your circumstances.
This is done by building a decision tree: a framework that allows businesses or organizations to make consistent choices or classifications of data.
Decision trees are helpful for repeated processes that may not be carried out by the same person every time—for example, a task that is shared by multiple team members. The decision tree makes it easy for anyone to understand the process at a glance and ensures that the task gets completed the same way every time, no matter who is doing it.
Back to topDecision Tree Templates & Examples
Decision Trees for Business Processes
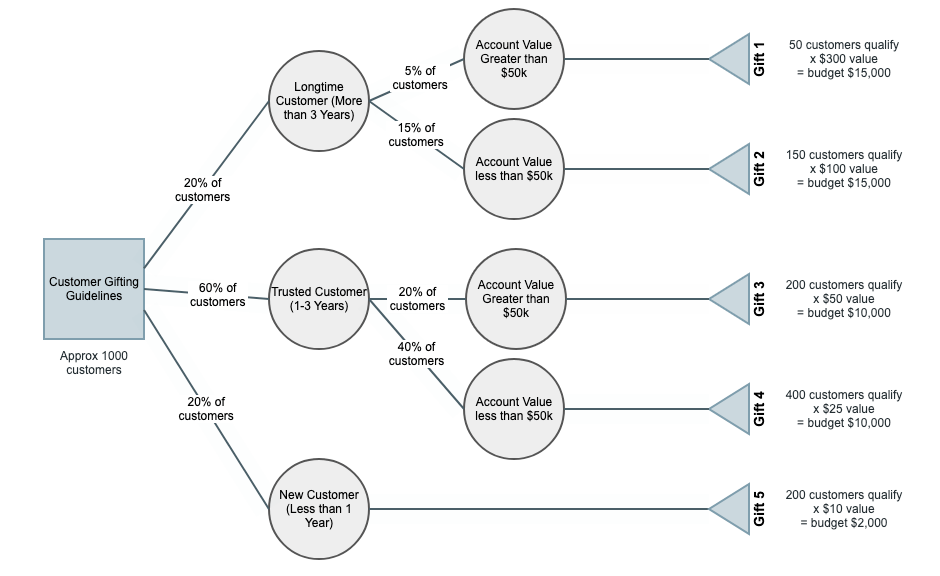
Decision trees are most helpful when they describe a process or decision you’ll make multiple times, like what gift to give to a customer based on the data you’ve collected (money spent with your company, length of relationship, etc). They help you make sure the process is completed correctly every time.

Decision Trees in ITSM
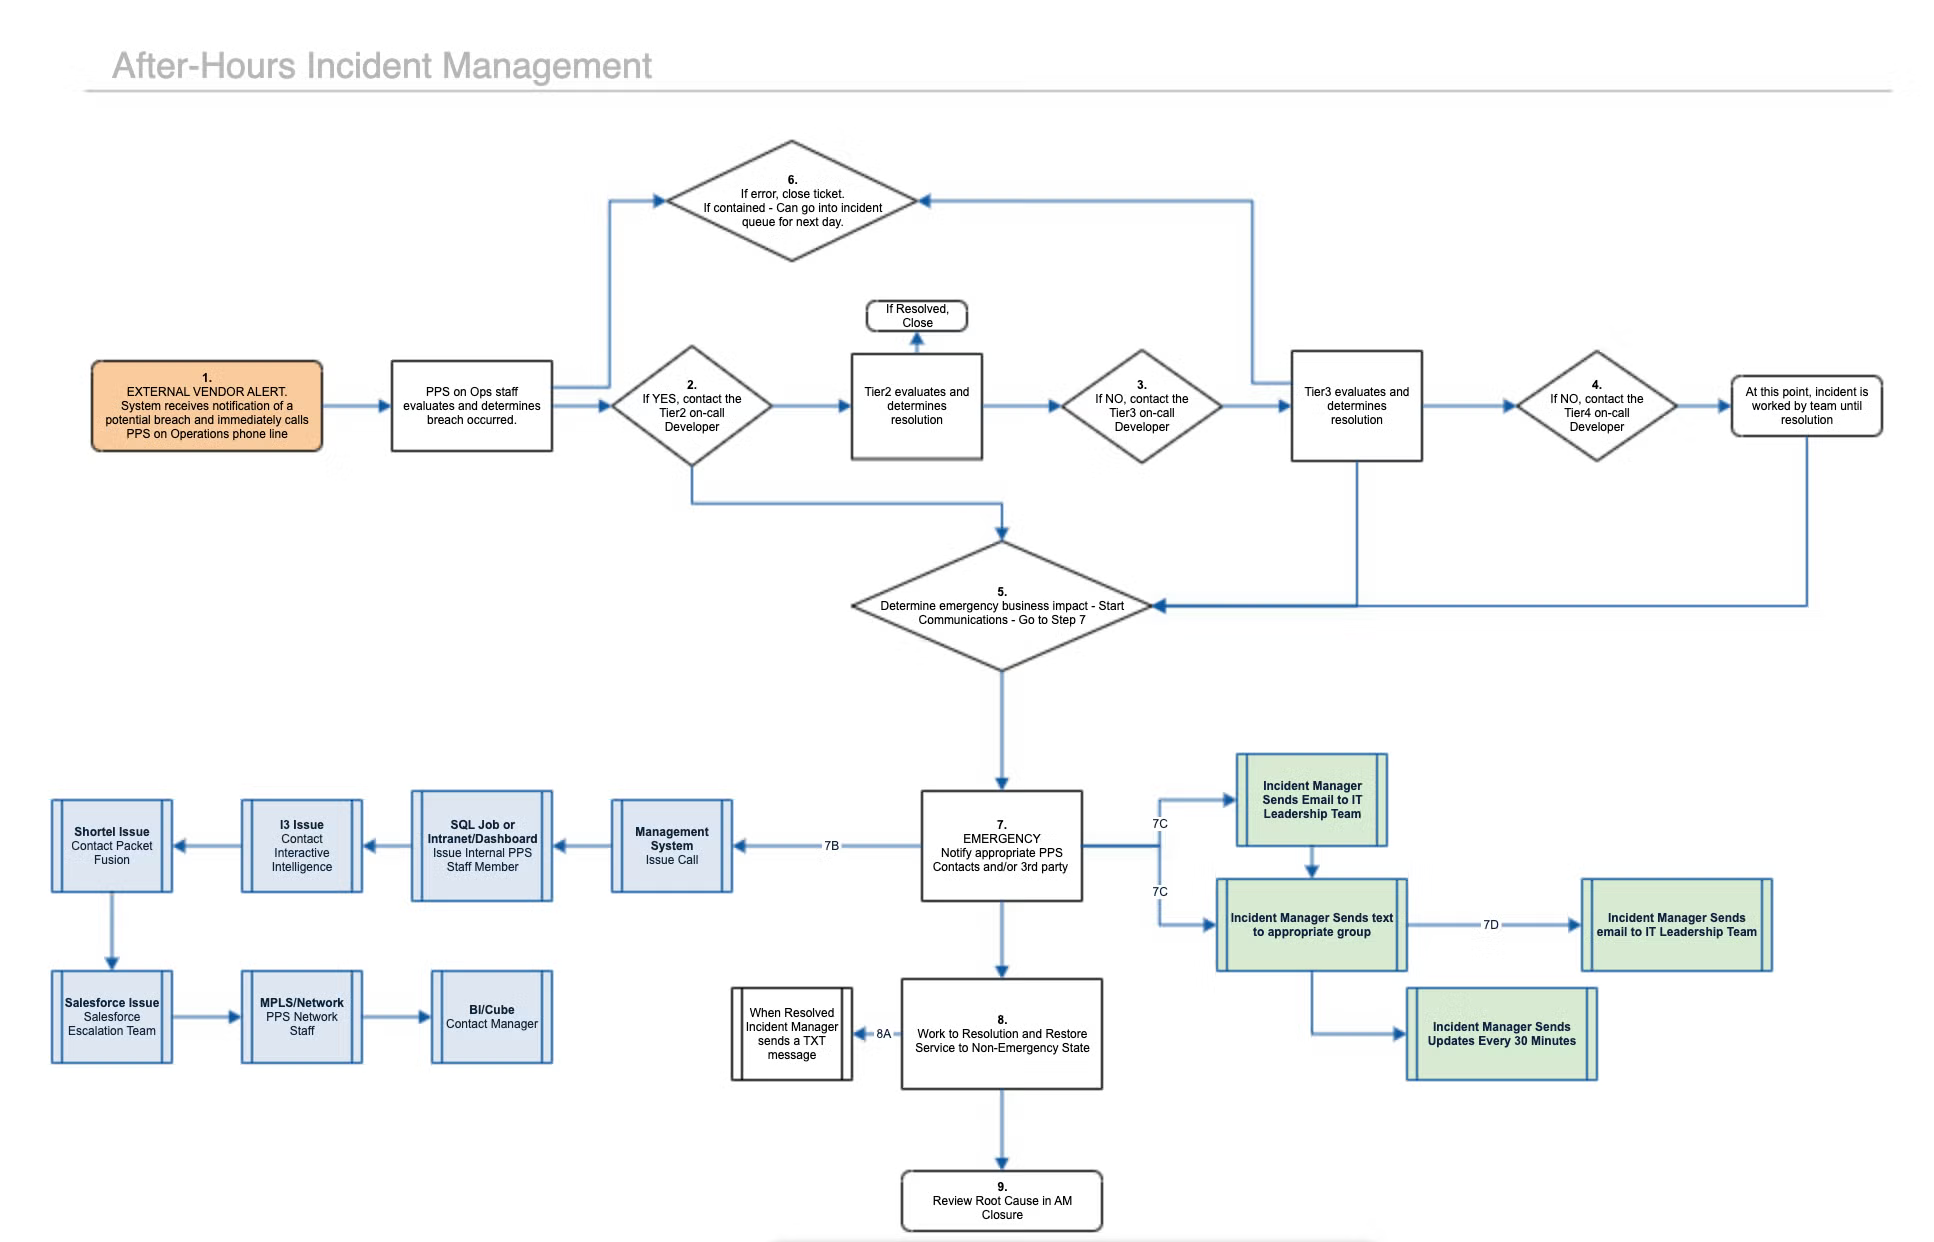
In IT service management, decision trees can be a helpful resource for incident management. For example, a decision tree can help a newly hired service desk agent execute the correct process to quickly resolve a ticket reported as a possible network security breach.
With a resource like a decision tree built into the ITSM team’s knowledge base integrated with Jira Service Management, any team member of any experience level can confidently resolve issues and provide excellent service.

Decision Trees in Machine Learning
In machine learning, a decision tree flowchart can help you understand what rules are being applied to a classification task or regression task. If you are trying to write an algorithm that completes these tasks, starting with a basic decision tree can be a good way to organize your thoughts.
Consider using a machine learning decision tree to create a rough draft of your algorithm or describe the outcomes of your regression analysis. This will make your technical work easier for non-technical stakeholders to interpret or understand.
Back to topHow to Make Decision Tree Diagrams
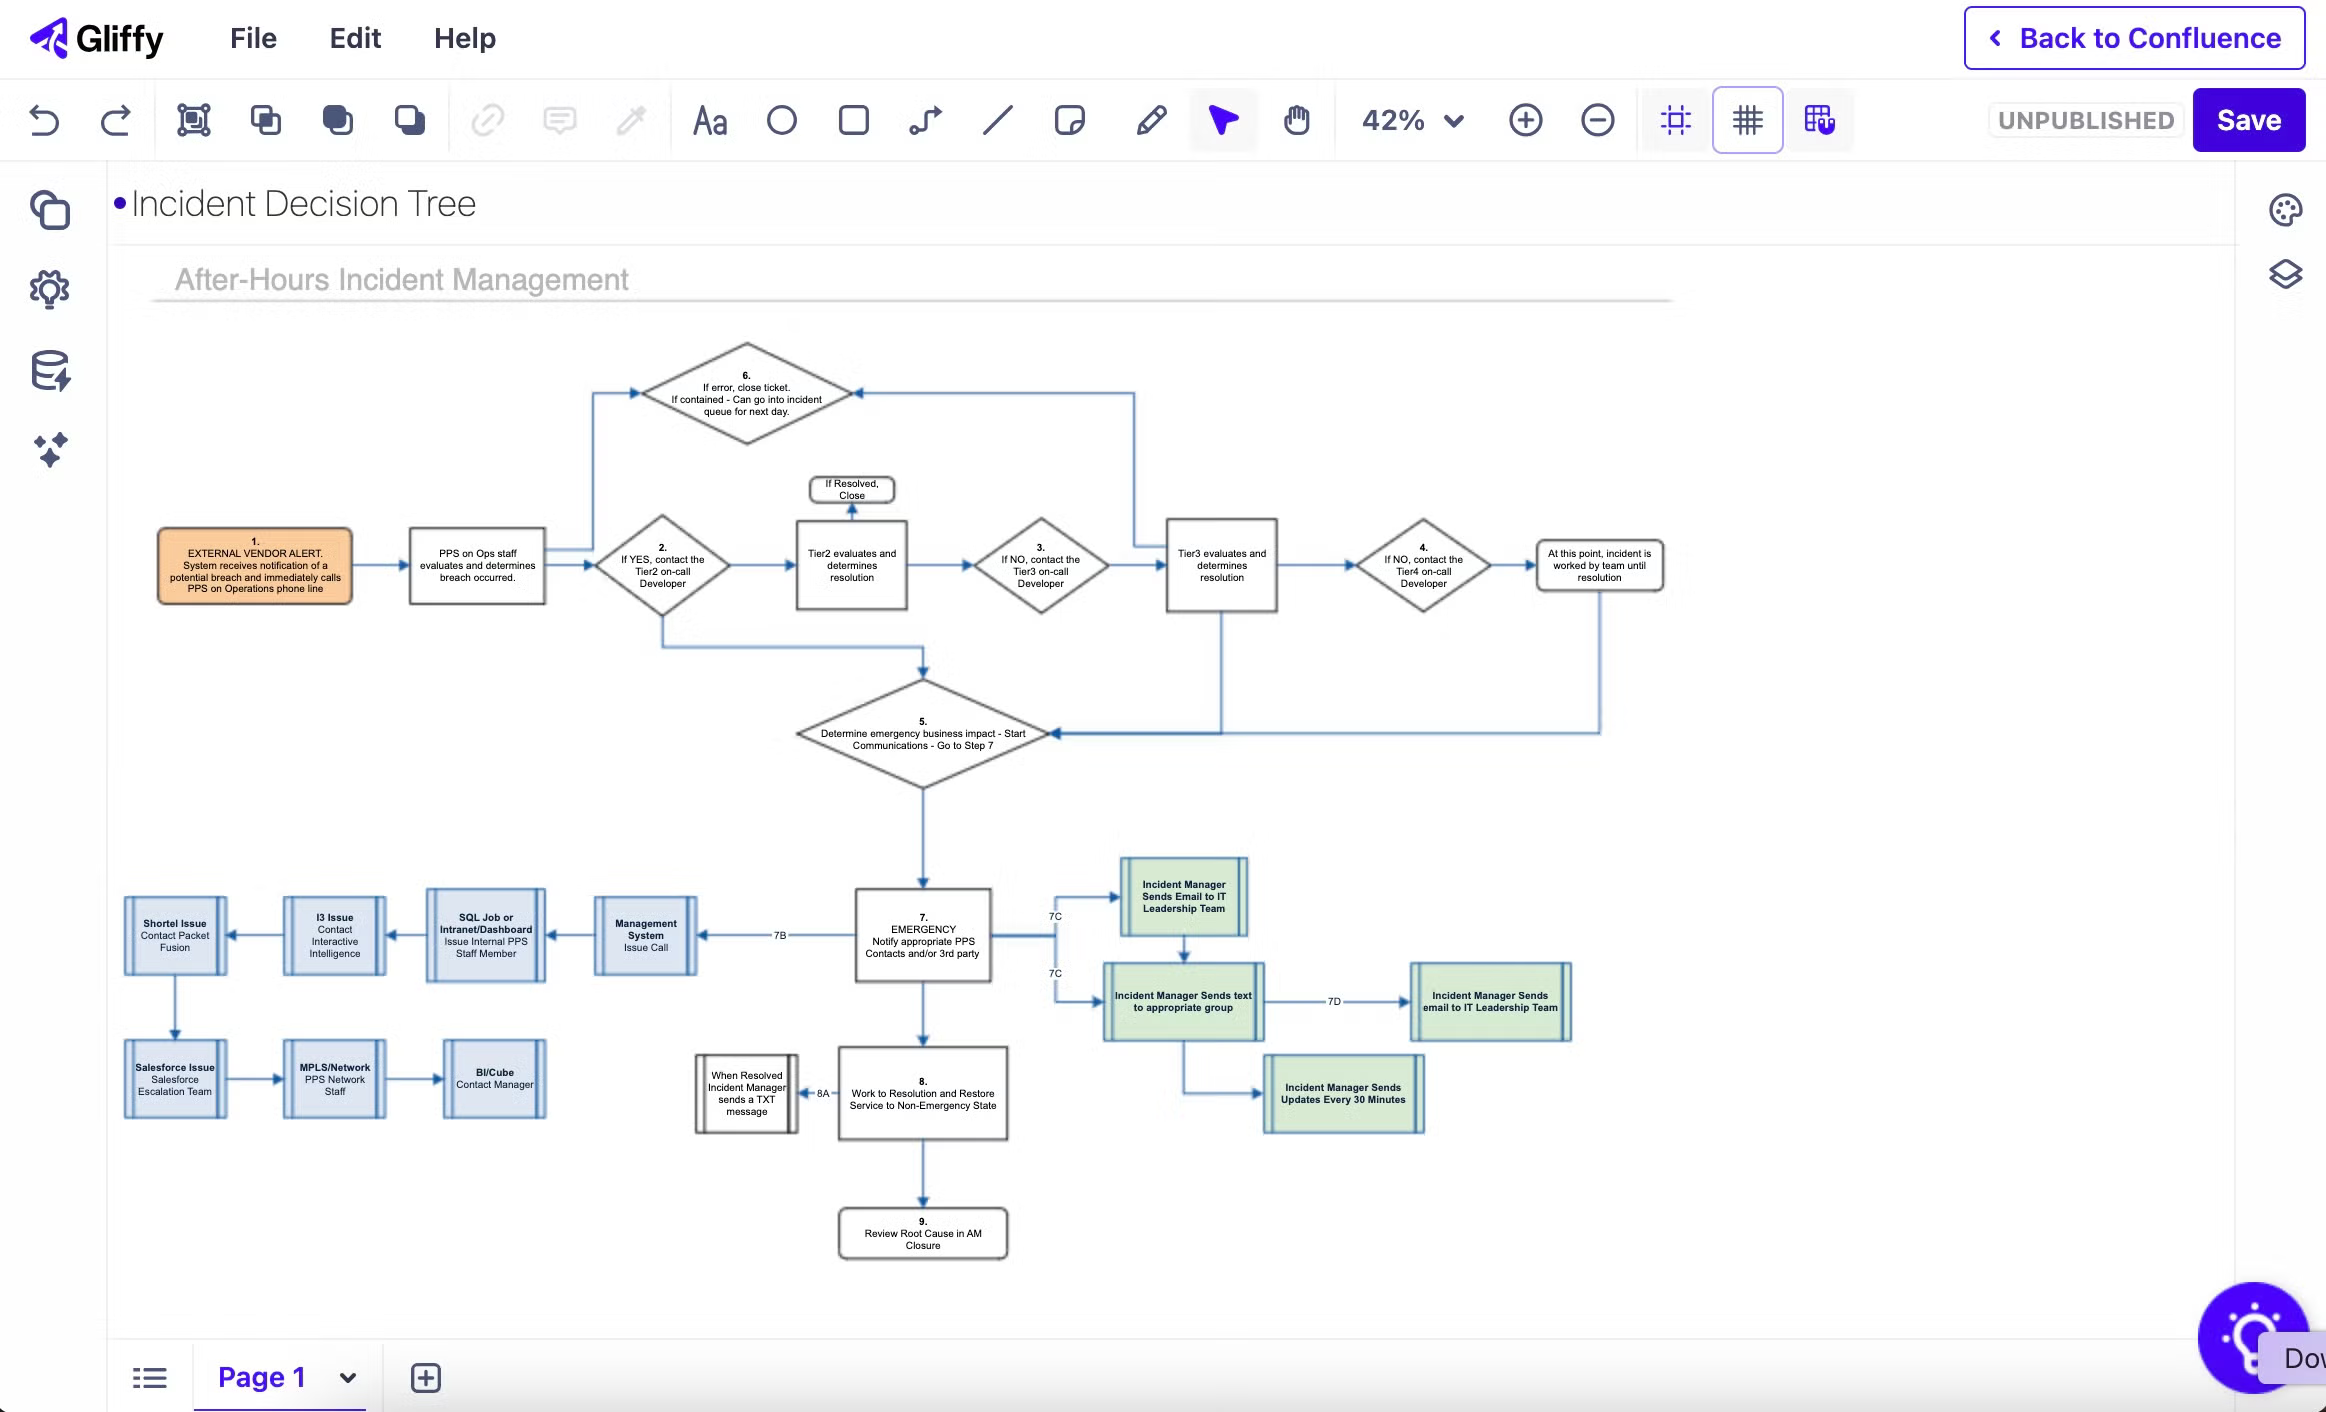
Follow along with this quick tutorial by starting a free trial of Gliffy for Confluence.
Step 1: The Situation
First, draw in a square or rectangle to represent the initial decision you’re making. This is called the root node. Give it a label that describes your challenge or problem.
Step 2: The Branches
Starting from the initial decision, go through the flow of the decision-making process and include a guide for what the viewer should do at each point where a decision might change the outcome.
Once you’ve laid out your decision and all the branching scenarios showing what could possibly happen, you’ll use the connector tool to draw lines between them and show the flow of activity.

Step 3: The Context
In Gliffy, you can add labels and notes to lines simply by clicking on them and starting to type. Depending on the use case for your diagram, these notes could by your estimated probability of this outcome occurring, simple descriptions like “yes” or “no” to help guide users through the decision tree, or the costs associated with the outcome.
Develop Decision Trees Directly in Confluence
By integrating decision trees into your workflows, you empower your teams with a reliable framework for solving problems and achieving better results.
Whether you’re streamlining incident management, enhancing collaboration, or developing algorithms, decision trees provide the clarity you need to move forward with confidence.
Ready to take the guesswork out of your decisions and unlock the full potential of your processes? Enhance your documentation with a decision tree—and build it directly in Confluence.