Blog
April 3, 2025
How to Draw Dependency Diagrams for Systems or Processes
IT Management,
Diagrams for Software Engineering,
Project Management
What is a Dependency Diagram?
Dependency diagrams, sometimes also called dependency graphs, are visualizations of processes or structures where certain steps or components are dependent on others.
Understanding the dependencies that make up systems and processes is an important step toward increasing efficiency—missing a key dependency when making changes or working on a project can lead to stalled processes, unexpected downtime, and extra work for your team.
In this blog, we will explore different types of dependency diagrams and how you can create them for your process or technical documentation.
Table of Contents
Dependency Diagrams in Project Management
One type of dependency diagram used by project managers is a PERT Chart, which lays out each step of a project, illustrating which steps are dependent on others.
A PERT chart also includes the amount of time it will take to complete each step, because this helps the project manager determine the critical path, or the longest (in time) chain of events that must be completed to finish the project.
Being able to visualize steps in the form of a dependency diagram is a good way to organize your project in the planning phase and communicate project information to stakeholders.

Dependency Diagrams in IT & Software Engineering
Sometimes, a software or IT team might use a dependency diagram to visualize processes, similar to how a project manager uses a PERT chart. For example, it can be helpful to map out the dependencies in an approval or incident response process.
However, dependency diagrams are not just for processes. You can also create them to illustrate technical concepts.
Code Dependencies
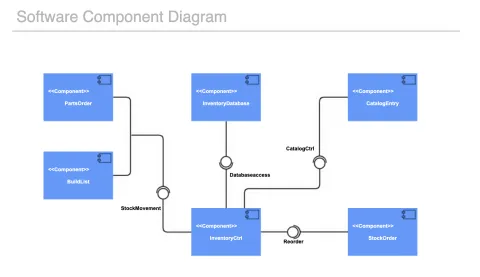
Dependency diagrams can help you map out the relationships between different parts of your software system and illustrate how they interact with each other.
Deployment diagrams and component diagrams are specific types of UML (unified modeling language) diagrams that include information about dependencies. You don’t need to create your dependency diagram in UML, but if that language is the standard in your organization, these are two options for you.

Application Dependencies
Diagrams can also show the dependencies between the various applications used by an organization as part of their IT infrastructure.
This type of diagram can assist the IT team with change management because it allows them to see the relationships between different parts of the infrastructure and analyze how connected services might be affected by a change.
How to Draw a Dependency Diagram
You won’t need any special shapes or lines to create a dependency diagram—they're typically made up of simple nodes (circles or ellipses) connected by solid arrows.
With that in mind, you can use any diagramming or mind mapping tool to create your dependency diagram. However, if you’re planning to store this diagram in Confluence alongside other technical or process documentation, you’ll save time by using a tool like Gliffy, which is directly integrated with Confluence.
When you create a new Gliffy diagram, you can drag and drop shapes onto the canvas to represent the nodes of your dependency diagram, then connect them with arrows using the connector tool.
Learn more about using shapes and connectors in Gliffy >>
Mermaid Dependency Graphs
Dependency diagrams are often complicated, and translating the thoughts in your mind to shapes on a canvas can take a lot of time and effort. To make your job easier, Gliffy offers a way to visualize dependencies directly from your keyboard.
If you map out the dependencies in your process or code using Mermaid syntax, you can copy and paste that text into Gliffy to automatically generate a diagram.
When you need to make changes, just click back into the Mermaid editor and edit the text. You’ll see the effects of the changes in the diagram preview box as you edit.
Learn how to create a Mermaid diagram in Gliffy >>
Technical Diagramming for Confluence
Visualizing complex concepts like cross-functional processes, code structures, and IT infrastructure doesn’t need to be a time-consuming challenge for your team. Add Gliffy to your Confluence space to diagram alongside your documentation without ever leaving the Atlassian ecosystem.
