What is a System Context Diagram?
A system context diagram is a high-level technical diagram that shows the external entities that interact with a system. It doesn’t show details about those interactions, just what they are. This can be helpful for gathering requirements and determining the scope of a project.
System Context Diagram Example
This system context diagram for class registration shows all the external factors that interact with the system.
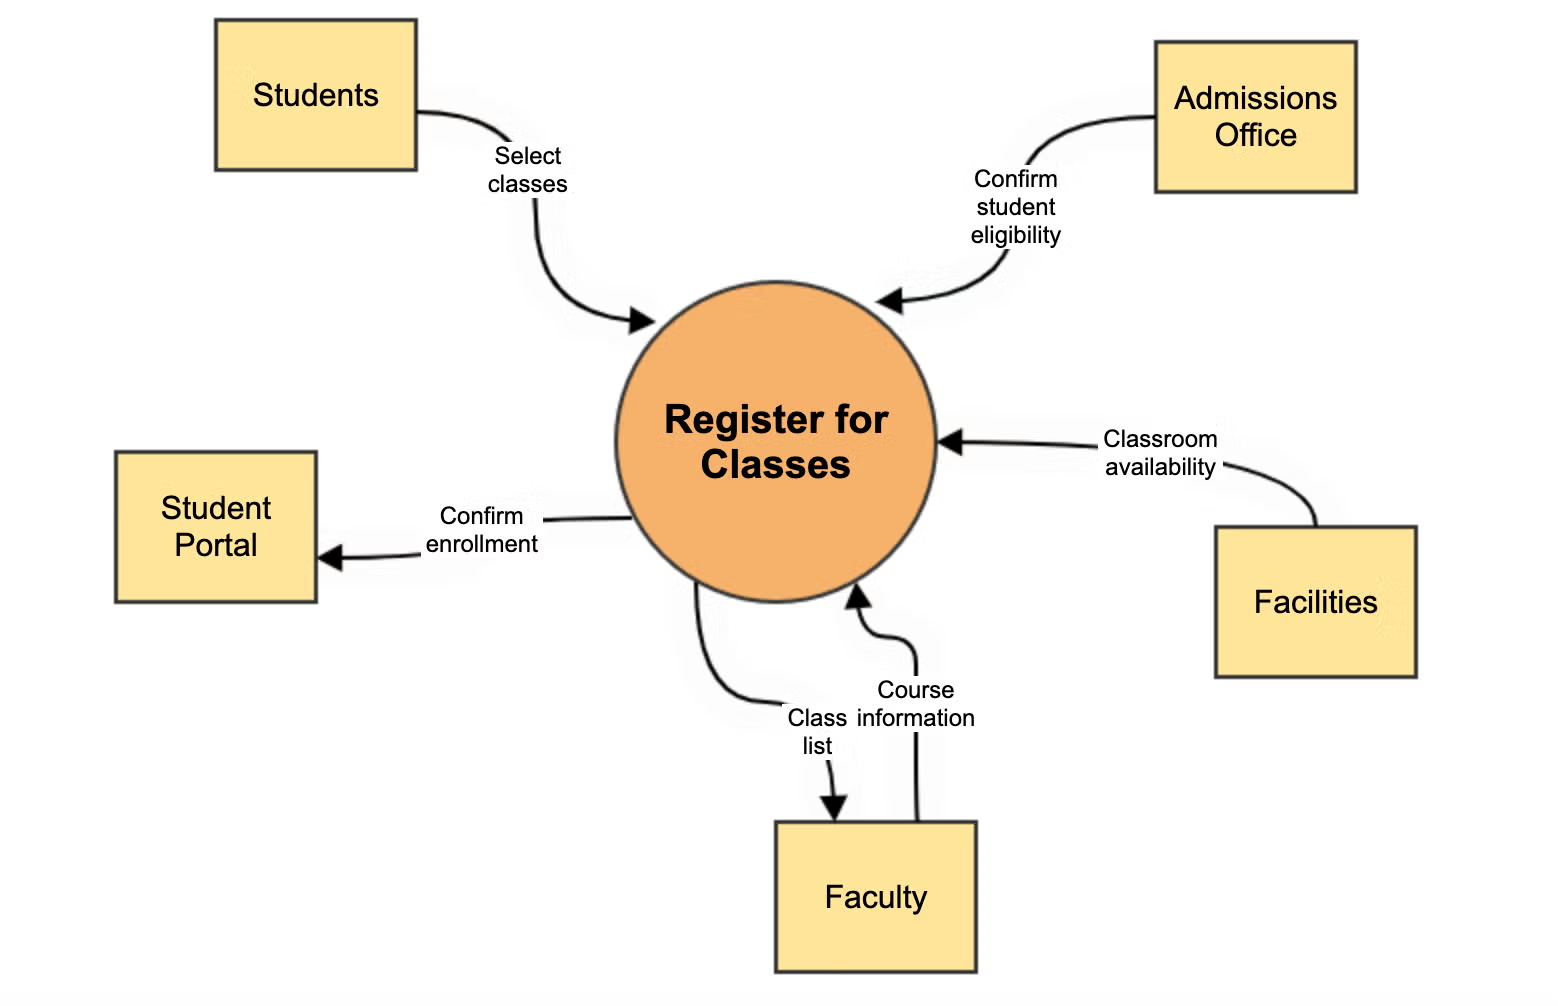
We’ll use this example as we guide you through how to create your own context diagram with Giffy later in this blog.
What’s the Relationship Between Context Diagrams & Data Flow Diagrams?
When you think of a data flow diagram, you’re more likely to imagine a complex technical diagram depicting processes in detail. This type of diagram is helpful for software documentation meant to be a resource for technical teams.
However, not all data flow diagrams are so detailed. They can be broken down into subcategories, also called “levels,” that show different layers of detail. A “Level 0” data flow diagram only shows the interaction between a system and its external influences—the same as a context diagram.
Because of this, “context diagram” and “data flow diagram” are sometimes used interchangeably, even though they’re not the same. All context diagrams could be considered level 0 data flow diagrams, but not all data flow diagrams are context diagrams.
Back to topWhen to Use a System Context Diagram
Context diagrams aren’t the most detailed type of technical diagram out there, so when would it be worth your time to create one?
During the Requirements Phase
The best time to create a high-level diagram like a context diagram is when you are gathering requirements for a project. It helps you define scope and identify areas for development.
System context diagrams can help you understand the resources that will be required to complete the project and make it easier for a project manager to allocate those resources properly.
A context diagram is also like a precursor to some of the essential application architecture diagrams that you will create for your more detailed technical documentation.
When Looking to Optimize
If you want to optimize a system, it’s a good idea to first identify all the external entities that interact with it. This will help you ensure there are no unexpected impacts to external systems when you make changes.
When Communicating with Non-Technical Stakeholders
You might be in a position where an executive at your organization wants information about a system, but they don’t need to see all the details. This is a great time to use a context diagram, because it tells them what they need to know at a high level and doesn’t require much explanation.
Back to topCreate Your Own Context Diagram
Identify the Entities in Your Diagram
Start by adding a circle to the middle of the diagram canvas, then double click on that circle to type the name of the system you’ll be focusing on. Which external entities interact with it? Start adding those entities in boxes around the circle.
Connect Entities to the System with Data Flows
When you know which entities interact with the system, draw arrows between each entity and the system showing what kind of interactions take place.
Make sure the arrow points in the direction that information is flowing—for example, in our scenario of a class registration system, students will input information about the classes they want to register for.
Sometimes, there might be interactions flowing both ways. You can show this by drawing more than one arrow between an entity and the system. Make sure to label each one with a high-level explanation of what the interaction entails.
Add the Final Touches
Are there additional notes that would help a viewer understand your diagram, like specific events that trigger certain interactions to begin? You can add these notes to your diagram directly or in popup notes that appear when you hover over a shape.
Back to topDiagram in Confluence with Gliffy
Now you’re all set to create your own system context diagram!
Want to learn about visualizing system interactions in more detail? Check out our resources on UML diagrams and data flow diagrams.
To follow along with this tutorial and create more diagrams, start your free 30-day evaluation of Gliffy.